

Some functions are defined in terms of a parameter. Sage can easily plot parametric functions:
var('t')
pp = parametric_plot((cos(t), sin(t)), (t, 0, 2*pi),
    fill=True, fillcolor='blue')
pp.show(aspect_ratio=1, figsize=(3, 3), frame=True)
The output from this code is as follows:
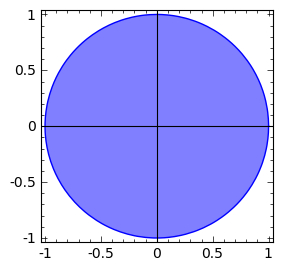
We
used two parametric functions to plot a circle. This is a convenient place to demonstrate the f
ill option, which fills in the space between the function and the horizontal axis. The fillcolor option tells Sage which color to use for the fill, and the color can be specified in the usual ways. We also demonstrated some useful options for the s
how method (these options also work with the show function). The option aspect_ratio=1 forces the x and y axes to use the same scale. In other words, one unit on the x axis takes up the same number of pixels on the screen as one unit on the y axis. Try changing the aspect ratio to 0.5 and 2.0, and see...