To illustrate the similarities and differences between plotting with matplotlib and plotting with Sage, we will repeat the first example of this chapter using the Pyplot interface to matplotlib. Enter and evaluate the following code:
import numpy
import matplotlib.pyplot as plt
x = numpy.arange(-2 * numpy.pi, 2 * numpy.pi, 0.1)
func1 = numpy.sin(x)
func2 = numpy.cos(x)
plt.figure(figsize=(5.5, 3.7)) # size in inches
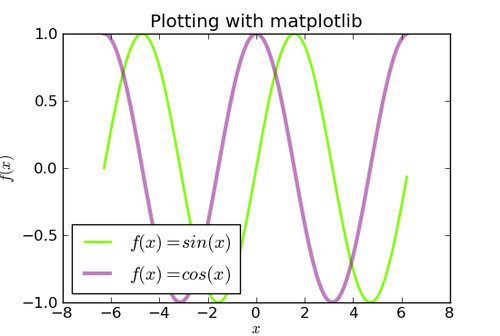
plt.plot(x, func1, linewidth=2.0, color=(0.5, 1,0), label='$f(x)=sin(x)$')
plt.plot(x, func2, linewidth=3.0, color='purple', alpha=0.5, label='$f(x)=cos(x)$')
plt.xlabel('$x$')
plt.ylabel('$f(x)$')
plt.title('Plotting with matplotlib')
plt.legend(loc='lower left')
plt.savefig('demo1.png')
plt.close()The result should be as follows: