Let's make an interactive 3D plot.
var('x, y')
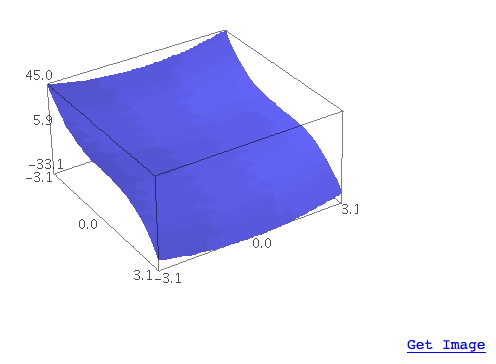
p3d = plot3d(y^2 + 1 - x^3 - x, (x, -pi, pi), (y, -pi, pi))
p3d.show()If you run this example in the notebook interface, a Java applet called Jmol will run in the cell below the code. If you run it from the interactive shell, Jmol will launch as a stand-alone application. Clicking and dragging on the figure with the left mouse button will rotate the plot in 3D space. Clicking and dragging with the centre button, or moving the scroll wheel, zooms in and out. Right-clicking brings up a menu that allows you to set various options for Jmol. Since Jmol is also used to visualize the 3D structures of molecules, some of the options are not relevant for plotting functions. Here is a screenshot of the function, plotted with Jmol: