In the following code, we will see how to access probability distributions in Sage, obtain random variates from a specified distribution, and plot their distribution:
import matplotlib.pyplot as plt
variance = 0.75
# GNU Scientific Library
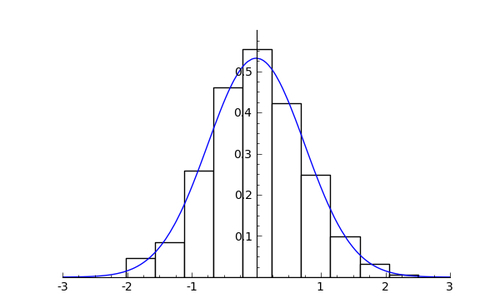
gaussian = RealDistribution('gaussian', variance)
gaussian.set_seed(0.0)
random_values = [gaussian.get_random_element() for i in range(1000)]
gaussian_plot = gaussian.plot((-5, 5))
# Get the Matplotlib object for the Gaussian plot
fig = gaussian_plot.matplotlib()
from matplotlib.backends.backend_agg import FigureCanvasAgg
fig.set_canvas(FigureCanvasAgg(fig)) # this line is critical
ax = fig.gca()
# Add a histogram
ax.hist(np.array(random_values), normed=True, facecolor='white')
ax.axis([-3, 3, 0, 0.6])
fig.savefig('hist.png')The result should look like this: