
After starting engagement on social media via HootSuite, we must track our efforts using various free and paid reports. These reports are really useful to measure results such as audience engagement from our social media activities, mainly undertaken from the HootSuite dashboard. It is very important to gauge how well your content was received by your fans, followers, and other users.
A marketer should have used HootSuite for posting on social media profiles to have adequate data for reports.
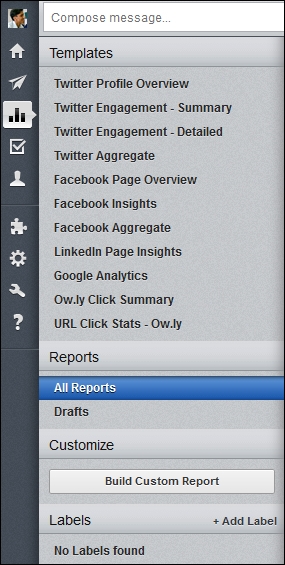
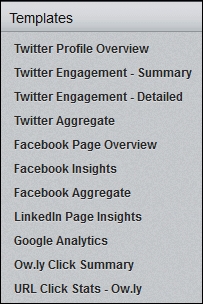
HootSuite Analytics can be accessed by clicking on the left-side bar and then selecting the graphics icon as shown in the following screenshot. There are saved templates that can be used for preformatted reports.
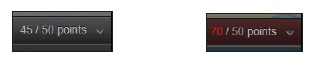
HootSuite reports and analytics work on a points-based system. These points can be purchased separately in the final step of completing your analytics reports. A Pro user gets 50 points for generating reports every month. If you are a Free account user, you will be required to upgrade your HootSuite account. Once you have finished adding modules to your report you can see the points counter at the top of your dashboard. If you exceed the available points, as an indicator, the number of points changes to red.
You can generate more than ten types of reports using HootSuite's Templates. This gives you an instant overview of what's happening with your social efforts across your Twitter account and Facebook pages.
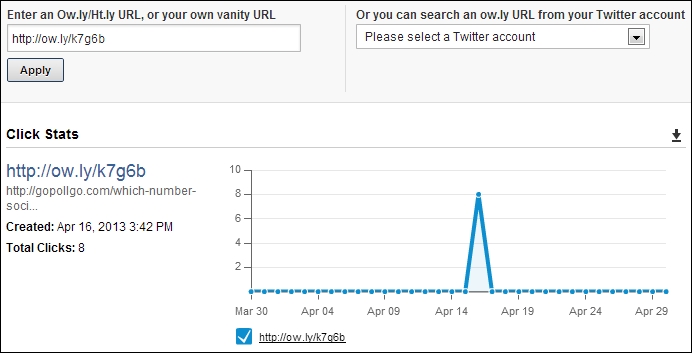
URL Click Stats - ow.ly provides you with statistics for any URL that has been shortened using HootSuite's in-house URL shortener and shared from its dashboard. This gives you the expanded web location of the link, in addition to the date of creation and total clicks registered on that specific link. You can also see a chart that shows the dates when that link recorded the clicks. In case you do not remember the link, you can search for stats about any ow.ly URL shared from your Twitter account by selecting the connected Twitter profile from the dropdown. It will give you details of your complete messages. You can click on the ow.ly links to check the engagement from that shortened URL.
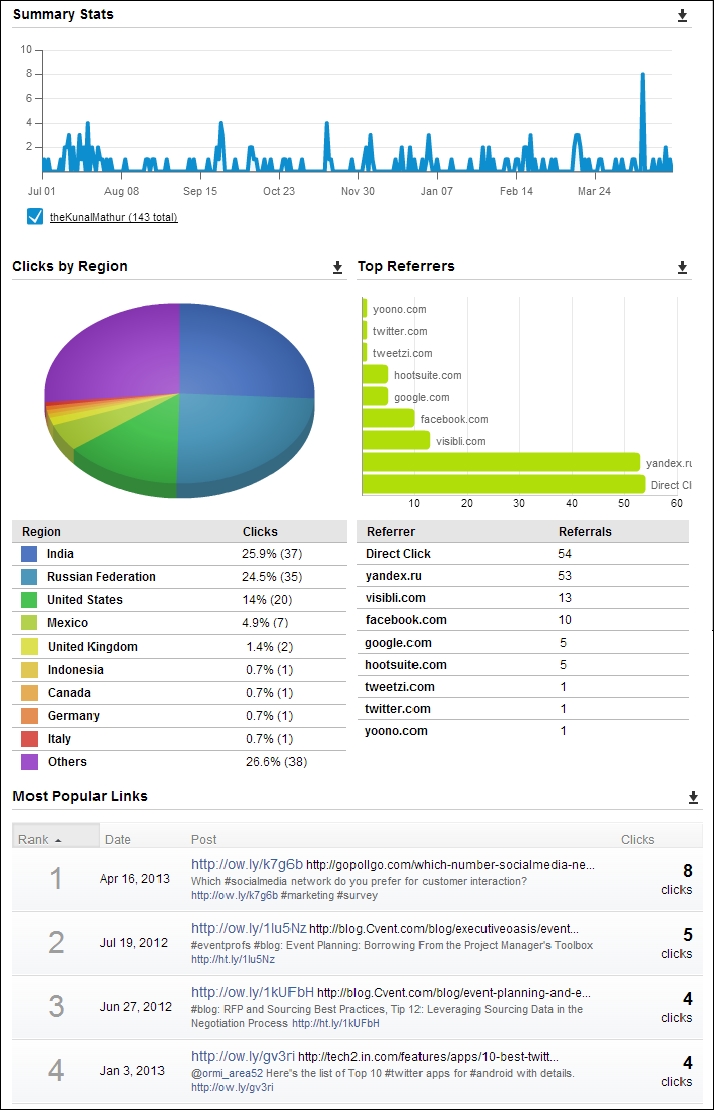
If you want more details and do not want to limit your report to an individual, click on Ow.ly Click Summary. It gives you details about the number of links clicked, region of user who clicked the link, top referrer website from where the clicks were registered, and a list of articles that registered the highest clicks. All this information helps you to understand your audience and plan your future messages accordingly.
The following screenshot of Ow.ly Click Summary shows how well these statistics are presented by HootSuite Analytics. They are easy to interpret and at the same time provide you with adequate information.
The Facebook Insight report shows similar statistics that are available to a page administrator directly after logging into Facebook. This allows you to identify total likes, new likes, people talking about this, reach, user demographics and location, among others. This is a free report and gives you an instant analysis of your brands' performance on Facebook.
After connecting Google Analytics to HootSuite you can generate reports of your website activity. A Google Analytics report provides you with useful web tracking information. However, you must connect your Google Analytics account to HootSuite before generating the Google Analytics report. This is also a paid report that requires 50 HootSuite points.
In addition to preformatted reports, you can also customize your reports with modules that you would like to see in the reports.
This also enables you to combine Twitter and Facebook stats in the same report. To use this feature, click on Build Custom Report under Customize and then select Custom Report. Start from scratch! And design your custom report.
This will open a new page where you can create a custom report. This page is divided into six major areas, as shown in the following screenshot:
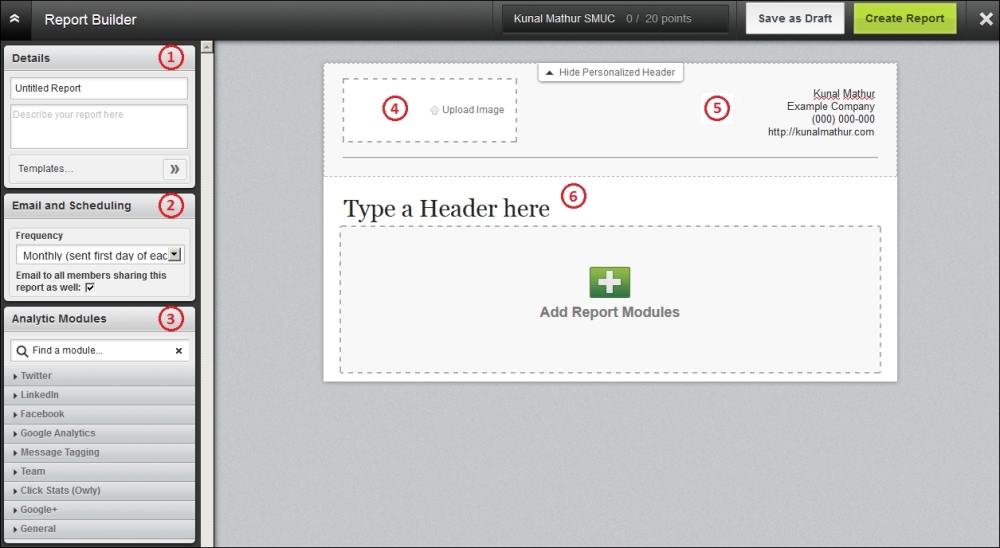
The Details field is used to label your report so that you can organize different types of reports by their content. The value entered here will not be the title of your report and this information will remain in HootSuite only.
You can use the Email and Scheduling section to schedule the delivery of reports directly to your mailbox. The frequency can be set to daily, weekly, monthly, twice a month, or no e-mail at all.
The Analytic Modules section has all the formats that you can use in your report. There are more than 60 modules for Twitter, LinkedIn, Facebook, Google+, and Google Analytics. You can add these modules to the report by simply clicking the faded + sign. Please note that some of these modules require points, whereas a few others are limited to Enterprise users.
You can upload your company's logo (recommended) or an image that represents the content of this report.
Marketers can edit the top-right section to update their name, contact information, company name, address, website, and other such details.
The section represented as number 6 in the preceding screenshot contains the header that becomes the title of your report. Generally, marketers mention their organization's name in this section.
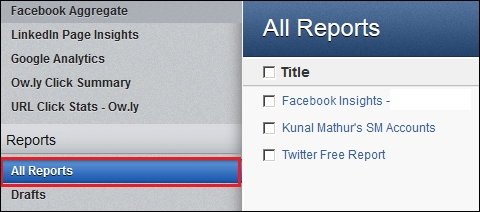
Click on Create Report once you have added all the required modules and have updated the six sections explained. You'll be sent back to the HootSuite Analytics page, where you can view or edit all reports created by you.
Modules that are available for free to all type a of users are:
Profile Summary: This section of the report shows your number of followers, number of users that you are following, number of lists that you are part of, and your Twitter bio. It is a representation of your Twitter profile.

Mentions by Influencers: It is very important for all marketers to know who is interacting with them on Twitter, retweeting their updates, and mentioning them in the tweets. Marketers should acknowledge them and thank them to make them feel special.

Summary Stats: This section shows the number of clicks on a timeline that helps marketers to identify the best day to send a specific type of message to get maximum clicks.

Clicks by Region: The following pie chart tells you about the location of the users who are clicking on the links shared by you. This can also prove helpful in developing campaigns for a specific location from where you are getting maximum clicks.

Top Referrer: This section shows you which sites sent the most traffic to your links. This can be useful if you use HootSuite to send messages to multiple social networks (Twitter, Facebook, LinkedIn, among others) and to see where your messages are the most effective.

Most Popular Links / All Links: It is very important for marketers to know which specific tweets got the most clicks from the audience. With the help of this information, you can get an idea on topics and subjects that really resonate with your audience. You can also try changing certain word patterns if they are more effective than others.

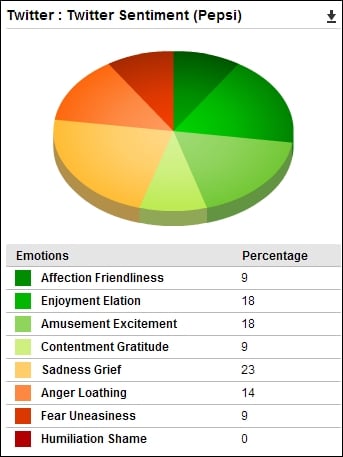
If you require detailed reports, HootSuite also provides paid modules that require points. One of the most important reports is the Twitter Sentiment report that shows the sentiment of users about a specific word or brand. In the following example, we have used Pepsi as the keyword and have generated a sentiment report.
A couple of more reports that can be generated at 20 points each are Retweet-Detailed and Mentions-Detailed reports. The Retweet-Detailed report creates a line graph showing the growth in retweets and a list of tweets that received the highest numbers of retweets.
The Mentions-Detailed report also generates a line graph depicting the increase in the number of mentions over a period of time and a list of users who mentioned your Twitter handle. The user with the highest Klout score is placed at the top of this list.
The Follower Growth-Count report creates a line graph that shows the increase in your number of Twitter followers. In addition to the daily increase/decrease of followers, this list also shows the average daily growth in followers and the total number of followers.
For LinkedIn company pages, you can create Snapshot and Company Update Engagement reports. Each of these reports costs 10 points. A Snapshot report covers the number of total and new followers, and the percentage increase in their numbers. It also shows statistics over impressions and engagement. However, these statistics are already available to page administrators directly from LinkedIn.
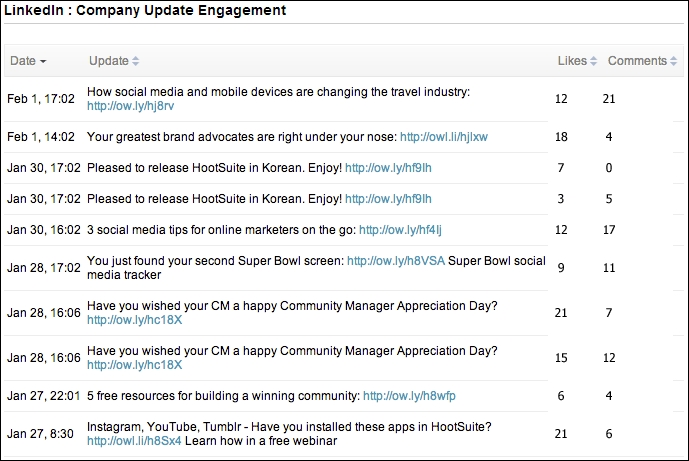
The Company Update Engagement report shows the posts and the number of likes and comments received on each one of them. This is helpful for marketers to understand what is being read and liked by the page followers. Messaging can be edited as per the results from this report.
Businesses have started to acknowledge the importance of social media but the problem to identify actual ROI and its effects on sales is still unclear.
The number of retweets, favorites, likes on Facebook posts, shares, or comments may not be enough to justify efforts and money invested in social media. So it is important to link social media to bigger departmental or organizational goals. It is very important to create a relation ship between conversation and conversion.
HootSuite reporting gives a detailed analysis of your social media presence, activities, target audience, demographics, and other details that help you to make crucial business decisions.
You may check the price of all HootSuite's analytics modules in points and their descriptions from the following link http://bit.ly/1c6l9Br.