

This recipe will show how to utilize statistics to better serve one's readers.
Statistics can be very useful in blogging. They do, however, require a Pro account on Edublogs. Statistics show how many visits your blog gets, which posts readers look at, and where they come from. There is a potential downside to looking at statistics, though. It is very easy to obsess over statistics. To combat this, remember why you started blogging and let that guide you. Statistics are a tool; they are not the only indicator of the success of a blog.
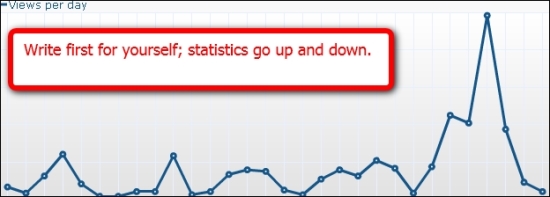
Developing a blog audience takes time. Even once your blog has a steady audience, there will be highs and lows. Following is a diagram of a random 30-day period from one of my blogs. There was one outstanding day, several good days, and some bad days. That is all fine; I know that I have a regular audience that will continue to come back, as we have developed a mutually beneficial relationship over several years based on quality content and authentic dialogue.
This recipe will show how to utilize statistics. The Stats section of the navigation menu has several different useful options, which are described in the following section:
The Visitors Summary page is the one most people look at most often. It is broken down into the following sections:
Last Visits: This section shows a graph of the basic visits to the blog.
Visits Summary: This section is a basic list of actions users have done, and how long they have visited the blog for.
Visitor World Map: The map is an interactive display of where users have come from, shown in the following screenshot:

Visitors in Real Time: This shows what pages users are looking at when you loaded the page.
Visitor Referrers: This shows how users found the blog.
Each of these sections can be minimized by pressing the down arrow.
If you click and hold on the header, it can be moved and rearranged on the page.
Further, hovering over the headers displays a configure link. This gives you much more fine grained control over what the graphs show. For example, this lets you change the data period and the data analyzed by the Last Visits graph.
In addition, several of the graphs allow you to export them as an image or any of the following file types: CSV, Excel, JSON, PHP, and XML. Creative developers can do interesting things with that data.
Following are the three other sections in the Stats that deal directly with important statistics.
Content: This page shows which pages readers looked at, and for how long.
Referrers: This page shows how users came to the blog, such as directly to the blog, from clicking on a search engine (as well as what was searched for), or clicking on a link from a website, such as Facebook or Twitter.
Visitor Details: This has demographic information about the readers, such as their screen resolution, what operating system they are using, or what browser they are using.
These statistics are a tool that collectively can tell you a lot about your readers. Looking at your statistics, there are many questions that you can ask yourself.
Are there any topical trends in terms of what posts users visit most or spend the most time reading?
How are users finding your blog (search engine, a particular social network, and so on)?
Are your visitors from a specific locale?
Are most of your readers using mobile devices or traditional desktops/laptops (mobile lends itself to shorter posts)?
These are just a few of many examples. Statistics should never be the only impetus when determining what and how to write, but they do show what your readers are looking for. If part of the reason for blogging is to make a difference, it is helpful to know what readers' needs are, and to try to fill those needs.
There is one more option in the Stats menu for advanced users. If you feel that you need even more detailed statistics, Edublogs supports Google Analytics. Analytics is a system built by Google for tracking website visitors. Sign up for a Google Analytics account at http://www.google.com/analytics/. Then, go to the Stats menu, click on the Google Analytics entry, and add you Google Analytics tracking code.