

There are certain devices (such as stereo cameras, 3D lasers, the Kinect sensor, and so on) that provide 3D data—usually in the form of point clouds (organized/ordered or not). For this reason, it is extremely useful to have tools that visualize this type of data. In ROS, we have rviz or rqt_rviz, which integrates an OpenGL interface with a 3D world that represents sensor data in a world representation, using the frame of the sensor that reads the measurements in order to draw such readings in the correct position with respect to each other.
With roscore running, start rqt_rviz with (note that rviz is still valid in ROS hydro):
$ rosrun rqt_rviz rqt_rviz
We will see the graphical interface of the following screenshot, which has a simple layout:
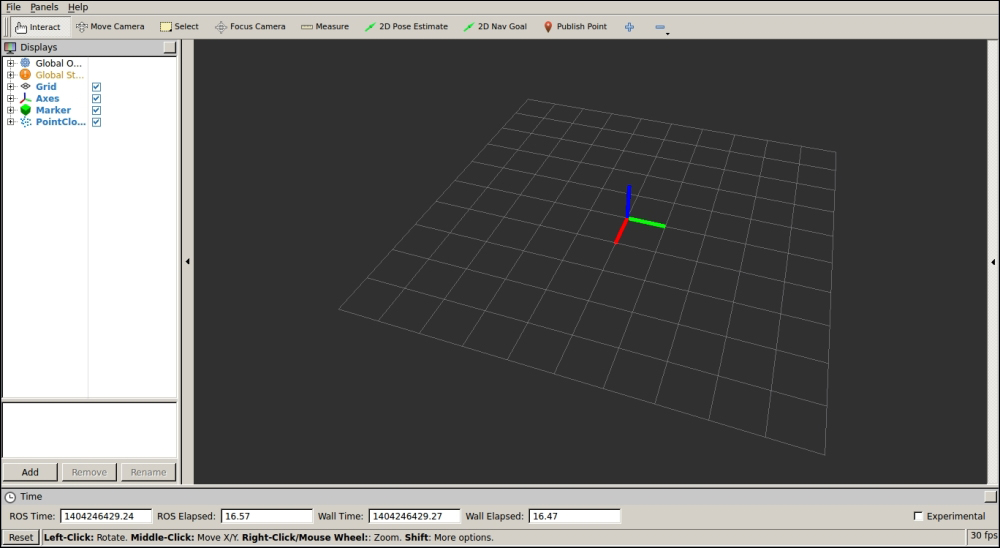
On the left-hand side, we have the Displays panel, in which we have a tree list of the different elements in the world, which appears in the middle. In this case, we have certain elements...