

The first time you login, use the username admin and password admin (for Linux) or cactipw (for Windows). You will be forced to change the admin password but, after doing so, you will be presented with the Cacti web interface:
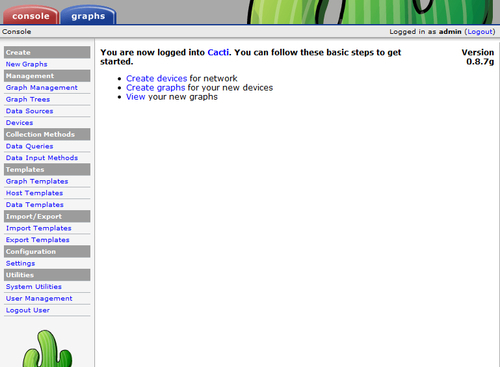
The initial page is called the Console and only administrators and users with special access rights are able to see it. From here you can fully administer Cacti.
The Console tab is where you manage your Cacti installation. From here you can add devices and users or create graphs and assign them to a tree. We're going to explain each of the menu sections next.
The Create section provides an easy access for new graph creations for specific devices. It's a shortcut to the Create Graphs link within each device.
The Management section, as its name suggests, allows the management of graphs, devices, data sources, and graph trees. Within this section you can add/edit or delete devices, delete graphs, add devices to trees, and much more.
The Collection Methods section describes the different ways in which Cacti retrieves data from devices or systems. Here you can manage data queries such as SNMP retrieve methods, or manage the different input methods which are used by external scripts called from the poller.
The Templates section provides an easy way of combining data templates into a graph (graph templates), graphs, and data queries for a specific type of host (host templates), or different data source items (data templates). Many graph, data, and host templates are available on the Cacti forums.
The Import/Export section allows the import and export of templates. This is especially useful for providing templates of exotic devices to the Cacti community, or to import them from one of the many provided on the Cacti forum.
Cacti doesn't yet provide a method for importing or exporting other data (for example, device lists) from within the web interface.
Within the Configuration section we can change the settings of Cacti. These settings include:
General settings (for example, logging levels)
Paths settings (similar to the paths page from the installer)
Poller settings (number of threads, or poller type to use)
Graph export settings (graphs can be exported to a local path or remote FTP server)
Visual settings (size of the graphs, font size to use)
Authentication settings (local authentication, LDAP, or HTTP Basic)
The Graphs tab is the main screen for end users. Here they can view the graphs for their devices and systems and also change some personal settings:
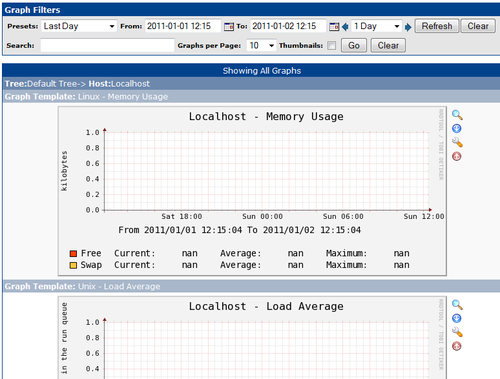
The Graphs tab contains a hierarchical tree to the left containing all of the devices which a user is allowed to view. The main part of the page contains the graphs and a filtering system which can be used to customize the timeframe or to search for specific graphs.