
This recipe will show some of the options available to capture traffic. As we will see, each of the alternatives will depend on the objectives of the analyst and the available network infrastructure.
The methods that follow are described as some of the best alternatives used to capture traffic.
A good and quick option for this is to install bridge-utils (the bridge utilities package for Linux).
Running
aptitude install bridge-utilsin our Ubuntu machine will be enough to install this package. To configure both interfaces (in the exampleeth0andeth1) we will execute the following command:bmerino@Mordor:/$ sudo brctl addbr Tshark_Bridge bmerino@Mordor:/$ sudo brctl addif Tshark_Bridge eth0 bmerino@Mordor:/$ sudo brctl addif Tshark_Bridge eth1 bmerino@Mordor:/$ sudo ifconfig Tshark_Bridge up bmerino@Mordor:/$ tshark -i Tshark_Bridge
This would generate the following output:
Capturing on Tshark_BridgeAs can be seen, all that is necessary is to create a bridge-type interface (
Tshark_Bridgein the example) and add the physical interfaces that form part of the bridge. Then we tell Tshark to use that interface to capture traffic.
To specify the data traffic in which we are interested, we have to create an access control list (ACL) and assign it to the external interface of the firewall (outside the interface) through the capture command.
asa(config)# access-list CAPTURE10 extended permit tcp any host 192.168.1.100 eq http
asa(config)# access-list CAPTURE10 extended permit tcp host 192.168.1.100 eq http any
asa(config)# exit
asa# capture tshark access-list CAPTURE10 interface outside
asa# copy capture:tshark tftp://192.168.1.130/example pcap
Finally, we can download and examine the file from Tshark with the –r option.
bmerino@Mordor:/$ tshark -r /tmp/example -R "http.request.method == GET"This would generate the following output:
2 2.009083000 192.168.1.129 -> 192.168.1.100 HTTP 114 GET /admin/upload/c99.php HTTP/1.1
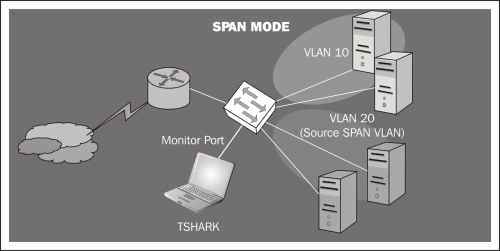
To do this, we only need to specify the VLAN/VLANs or interfaces in which we are interested and select a monitor port to which we will connect our Tshark machine. In the example, all ports belonging to VLAN 20 will be monitored:
Switch(config)# monitor session 1 source vlan 20
Switch(config)# monitor session 1 destination interface gigabitethernet0/1
Switch(config)# end
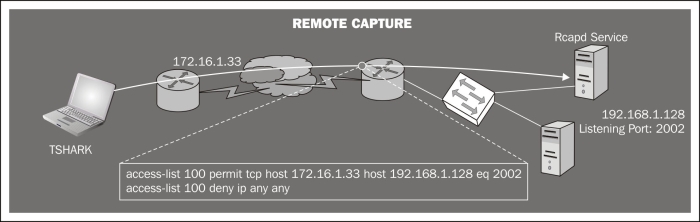
We need to run the
rpcapdservice on the server host and specify the port to which we want to connect. We select the port with the-poption. With-n(null authentication) the service will not require authentication.C:\Archivos de programa\Wireshark>tshark.exe –D 1.\Device\NPF_{8AB20E76-FBFB-4C7D-B623-CF37D227ED5D} (Realtek 10/100/1000 Ethernet NIC C:\Archivos de programa\Wireshark>rpcapd.exe –n –p 2002
Press Ctrl + C to stop the server.
From the client computer (Tshark machine), we need to run Tshark specifying as listener interface the word
rpcapfollowed by the IP/port and the server interface name in which we are interested.Note
Note that the name of the interface on Windows systems will consist of a long string, so you will probably need to write its name down before launching Tshark (that's why we run
tshark -Don the server, just to know its name).C:\Program Files\Wireshark>tshark –n –i rpcap://192.168.1.128:2002/\ Device\NPF_{8AB20E76-FBFB-4C7D-B623-CF37D227ED5D} Capturing on rpcap://192.168.1.128:2002/\ Device\NPF_{8AB20E76-FBFB-4C7D-B623-CF37D227ED5D} 0.000000 00:13:e8:f6:26:ef -> 90:e6:ba:bd:9f:48 ARP 60 Who has 192.168.1.128? Tell 192.168.1.129
To intercept, for example, traffic between a certain host (192.168.1.49) and its gateway (192.168.1.1) in our VLAN (if no countermeasures are implemented in the switch such as Dynamic ARP Inspector, Port Security, and so on), it would be enough with:
root@Mordor:~# ettercap -T -M arp:remote /
192.168.1.1/
 /
192.168.1.49/
 -i wlan1
ettercap NG-0.7.4.2 copyright 2001-2005 ALoR & NaGA
Listening on wlan1... (Ethernet)
 wlan1 -> 00:13:E8:F6:26:EF      192.168.1.50     255.255.255.0
If the attack is successful, we would get an ARP cache poisoning of both hosts associating their MAC IP with ours. Thus all traffic would go through our host, from which you could run Tshark on the wlan1 interface.
Let's look at each of the options previously seen.
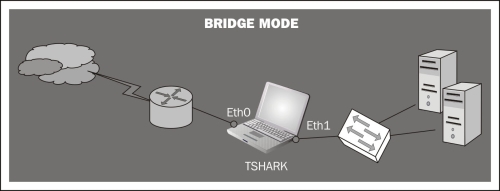
Bridge mode: By configuring our Linux host in bridge mode we would manage to do a physical MitM (man-in-the-middle), from which we could capture traffic and from where you will have access to all traffic throughput. Obviously, to perform this configuration we will need two network cards and some kind of software that allows us to manage the traffic passing through those interfaces. The main disadvantages of this capture method are the interruption of communications during the installation and having a single failure point in case of physical failure; something which under certain circumstances is unacceptable.
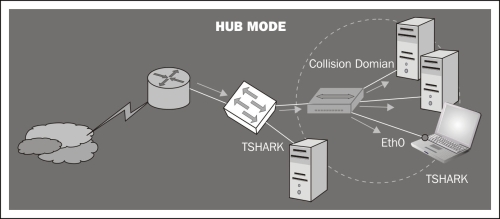
Hub mode: When you connect your Tshark machine to one of the switch ports, you are just seeing the frames passing between the switch and your host. The switch divides the network into segments, creating separate collision domains and eliminating the necessity for each station to compete for the medium. In this case the switch will send frames to all ports (belonging to the same VLAN) in the case of broadcast packets (for example, to know the physical address of a certain host). If our intention is to capture the traffic of multiple computers connected to the same switch, we can make use of a hub. This way we don't need extra configuration. Since we are in the same collision domain as the hosts we want to monitor, we just need to execute Tshark specifying the interface connected to the hub. Note however that this option would slow down the network performance, thus creating a single collision domain. Also, consider the security implications that this configuration would entail since someone (as we are) could be listening for frames destined for other machines.
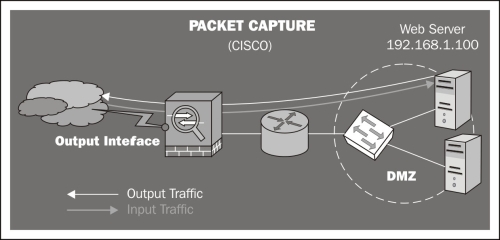
Packet capture: Some Cisco appliances can capture the traffic passing through their interfaces (the packet capture feature) and save it in a pcap file. In the next figure the external interface of a Cisco ASA firewall is configured to capture inbound and outbound traffic directed to the web server.
Port mirroring: configuring a port mirroring (SPAN mode in Cisco devices) is also a good alternative to capture traffic. This mode enables you to duplicate the traffic between one or more switch ports and mirror it to the port that you want. It is important to note that the port configured for mirroring has to be as fast as the port(s) to be monitored, to avoid packet loss.
Remote capture with rpcapd: If our networking devices lack NetFlow support (http://en.wikipedia.org/wiki/NetFlow) to capture traffic remotely, we can use rpcapd.
This tool is included in the default installation of WinPcap (the libpcap libraries for Windows) and allows us to set up a listening port to which we could connect remotely to get the traffic of that host.
Other methods: On certain occasions, if you cannot use the previous methods, you can use tools such as Ettercap, Dsniff, or similar to make a MitM (man-in-the-middle) attack. It is important to understand that this is a rather aggressive method and that it is only useful in non-critical environments where there is a need to intercept traffic between various hosts.