

When you first start Wireshark, you are presented with an initial Start Page as shown in the following screenshot:

Don't get too fond of this screen. Although you'll see this every time you start Wireshark, once you do a capture, open a trace file, or perform any other function within Wireshark, this screen will be replaced with the standard Wireshark user interface and you won't see it again until the next time you start Wireshark. So, we won't spend much time here.
If you have a number of network interfaces on your machine, you may not be sure which one to select to capture packets, but there's a fairly easy way to figure this out. On the Wireshark start page, click on Interface List (alternatively, click on Interfaces from the Capture menu or click on the first icon on the icon bar).
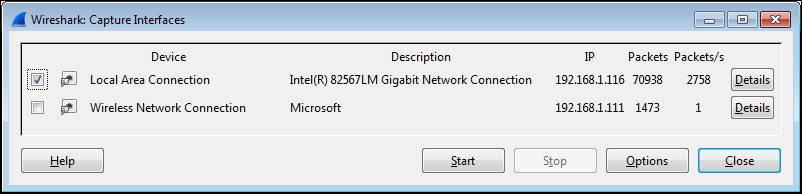
The Wireshark Capture Interfaces window that opens provides a list and description of all the network interfaces on your machine, the IP address assigned to each one (if an address has been assigned), and a couple of counters, such as the total number of packets seen on the interface since this window opened and a packets/s (packets per second) counter. If an interface has an IPv6 address assigned (which may start with fe80:: and contain a number of colons) and this is being displayed, you can click on the IPv6 address and it will toggle to display the IPv4 address. This is shown in the following screenshot:
Note
On Linux/Unix/Mac platforms, you might also see a loopback interface that can be selected to capture packets being sent between applications on the same machine. However, in most cases, you'll only be interested in capturing packets from a network interface.
The goal is to identify the active interface that will be used to communicate with the Internet when you open a browser and navigate to a website. If you have a wired local area network connection and the interface is enabled, that's probably the active interface, but you might also have a wireless interface that is enabled and you may or may not be the primary interface. The most reliable indicator of the active network interface is that it will have greater number of steadily increasing packets with a corresponding active number of packets/s (which will vary over time). Another possible indicator is if an interface has an IP address assigned and others do not. If you're still unsure, open a browser window and navigate to one of your favorite websites and watch the packets and packets/s counters to identify the interface that shows the greatest increase in activity.
Once you've identified the correct interface, select the checkbox on the left-hand side of that interface and click on the Start button at the bottom of the Capture Interfaces window. Wireshark will start capturing all the packets that can be seen from that interface, including the packets sent to and from your workstation. You'll see a bewildering variety of packets going by in the top section (called the Packet List pane) of the screen; this is normal. If you don't see this, try a different interface.
It's a bit amazing just how much background traffic there is on a typical network, such as broadcast packets from devices advertising their names, addresses, and services to and from other devices asking for addresses of stations they want to communicate with. Also, a fair amount of traffic is generated from your own workstation for applications and services that are running in the background, and you had no idea they were creating this much noise. Your Wireshark's Packet List pane may look similar to the following screenshot; however, we can ignore all this for now:

We're ready to generate some traffic that we'll be interested in analyzing. Open a new Internet browser window, enter www.wireshark.org in the address box, and press Enter.
When the https://www.wireshark.org/ home page finishes loading, stop the Wireshark capture by either selecting Stop from the Capture menu or by clicking on the red square stop icon that's between the View and Go menu headers.
Once you have completed your first capture, you will see the normal Wireshark user interface main screen. So before we go much further, a quick introduction to the primary parts of this user interface will be helpful so you'll know what's being referred to as we continue the analysis process.
There are eight significant sections or elements of the default Wireshark user interface, as shown in the following screenshot:

Let's look at the eight significant sections in detail:
Title: This area reflects the interface from where a capture is being taken or the filename of an open packet trace file
Menu: This is the standard row of main functions and subfunctions in Wireshark
Main toolbar (icons): These provide a quick way to access the most useful Wireshark functions and are well worth getting familiar with and using
Display filter toolbar: This allows you to quickly create, edit, clear, apply, and save filters to isolate packets of interest for analysis
Packet list pane: This section contains a summary info line for each captured packet, as well as a packet number and relative timestamp
Packet details pane: This section provides a hierarchical display of information about a single packet that has been selected in the packet list pane, which is divided into sections for the various protocols contained in a packet
Packet bytes pane: This section displays the selected packets' contents in hex bytes or bits form, as well as an ASCII display of the data that can be helpful
Status bar: This section provides an expert info indicator, edit capture comments icon, trace file path name and size information, data on the number of packets captured and displayed and other info, and a profile display and selection section
Somewhere in your packet capture, there are packets involved with loading the Wireshark home page—but how do you find and view just those packets out of all the background noise?
The simplest and most reliable method is to determine the IP address of the Wireshark website and filter out all the packets except those flowing between that IP address and the IP address of your workstation by using a display filter. The best approach—and the one that you'll likely use as a first step for most of your post-capture analysis work in future—is to investigate a list of all the conversations by IP address and/or hostnames, sorted by the most active nodes, and identify your target hostname, website name, or IP address from this list.
From the Wireshark menu, select Conversations from the Statistics menu, and in the Conversations window that opens, select the IPv4 tab at the top. You'll see a list of network conversations identified by Address A and Address B, with columns for total Packets, Bytes, Packets A→B, Bytes A→B, Packets A←B, and Bytes A←B.
Scrolling over to the right-hand side of this window, there are Relative Start values. These are the times when each particular conversation was first observed in the capture, relative to the start of the capture in seconds. The next column is Duration, which is how long this conversation persisted in the capture (first to last packet seen).
Finally, there are average data rates in bits per second (bps) in each direction for each conversation, which is the network impact for this conversation. All these are shown in the following screenshot:

We want to sort the list of conversations to get the busiest ones—called the Top Talkers in network jargon—at the top of the list. Click on the Bytes column header and then click on it again. Your list should look something like the preceding screenshot, and if you didn't get a great deal of other background traffic flowing to/from your workstation, the traffic from https://www.wireshark.org/ should have the greatest volume and therefore be at the top of the list.
In this example, the conversation between IP addresses 162.159.241.165 and 192.168.1.116 has the greatest overall volume, and looking at the Bytes A->B column, it's apparent that the majority of the traffic was from the 162.159.241.165 address to the 192.168.1.116 address. However, at this point, how do we know if this is really the conversation that we're after?
We will need to resolve the IP addresses from our list to hostnames or website addresses, and this can be done from within Wireshark by turning on Network Name Resolution and trying to get hostnames and/or website addresses resolved for those IP addresses using reverse DNS queries (using what is known as a pointer (PTR) DNS record type). If you just installed or started Wireshark, the Name Resolution option may not be turned on by default.
This is usually a good thing, as Wireshark can create traffic of its own by transmitting the DNS queries trying to resolve all the IP addresses that it comes across during the capture, and you don't really want that going on during a capture. However, the Name Resolution option can be very helpful to resolve IP addresses to proper hostnames after a capture is complete.
To enable Name Resolution, navigate to View | Name Resolution | Enable for Network Layer (click to turn on the checkmark) and make sure Use External Network Name Resolver is enabled as well. Wireshark will attempt to resolve all the IP addresses in the capture to their hostname or website address, and the resolved names will then appear (replacing the previous IP addresses) in the packet list as well as the Conversations window.
Note that the Name Resolution option at the bottom of the Conversations window must be enabled as well (it usually is by default), and this setting affects whether resolved names or IP addresses appear in the Conversations window (if Name Resolution is enabled in the Wireshark main screen), as shown in the following screenshot:

At this point, you should see the conversation pair between wireshark.org and your workstation at or near the top of the list, as shown in the following screenshot. Of course, your workstation will have a different name or may only appear as an IP address, but identifying the conversation to wireshark.org has been achieved.

You now want to see just the conversation between your workstation and wireshark.org, and get rid of all the extraneous conversations so you can focus on the traffic of interest. This is accomplished by creating a filter that only displays the desired traffic.
Right-click on the line containing the wireshark.org entry and navigate to Apply as Filter | Selected | A<->B, as shown in the following screenshot:

Wireshark will create and apply a display filter string that isolates the displayed traffic to just the conversation between the IP addresses of wireshark.org and your workstation, as shown in the following screenshot. Note that if you create or edit a display filter entry manually, you will need to click on Apply to apply the filter to the trace file (or Clear to clear it).

This particular display filter syntax works with IP addresses, not with hostnames, and uses an ip.addr== (IP address equals) syntax for each node along with the && (and) logic operator to build a string that says display any packet that contains this IP address *and* that IP address. This is the type of display filter that you will be using a great deal for packet analysis.
You'll notice as you scroll up and down in the Packet List pane that all the other packets, except those between your workstation and wireshark.org, are gone. They're not gone in the strict sense, they're just hidden—as you can observe by inspecting the Packet No. column, there are gaps in the numbering sequence; those are for the hidden packets.
Now that you've isolated the traffic of interest using a display filter, you can save a new packet trace file that contains just the filtered packets.
This serves two purposes. Firstly, you can close Wireshark, come back to it later, open the filtered trace file, and pick up where you left off in your analysis, as well as have a record of the capture in case you need to reference it later such as in a troubleshooting scenario.
Secondly, it's much easier and quicker to work in the various Wireshark screens and functions with a smaller, more focused trace file that contains just the packets that you want to analyze.
To create a new packet trace file containing just the filtered/displayed packets, select Export Specified Packets from the Wireshark File menu.
You can navigate to and/or create a folder to hold your Wireshark trace files, and then enter a filename for the trace file that you want to save. In this example, the filename is wireshark_website.pcapng. By default, Wireshark will save the trace file in the pcapng format (which is the preferred format). If you don't specify a file extension with the filename, Wireshark will provide the appropriate extension based on the Save as type selection, as shown in the following screenshot:
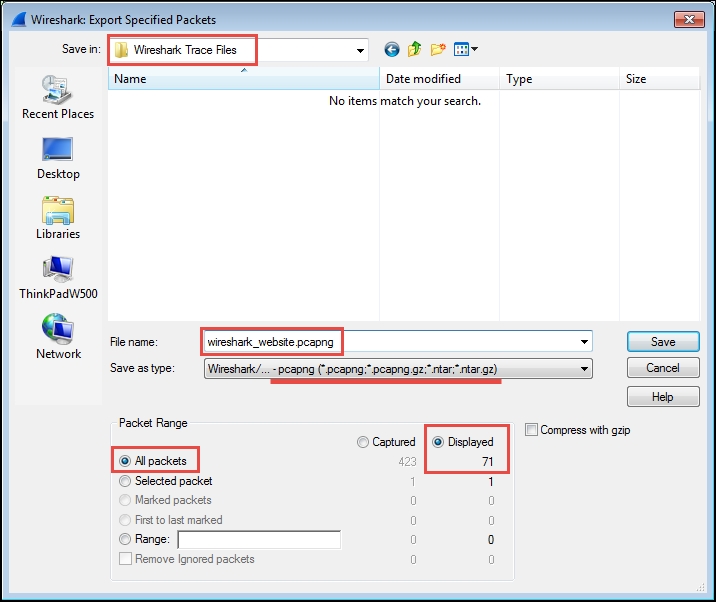
Also, by default, Wireshark will have the All packets option selected, and if a display filter is applied (as it is in this scenario), the Displayed option will be selected as opposed to the Captured option that saves all the packets regardless of whether a filter was applied. Having entered a filename and confirmed that all the save selections are correct, you can click on Save to save the new packet trace file.
Note that when you have finished this trace file save activity, Wireshark still has all the original packets from the capture in memory, and they can still be viewed by clicking on Clear in the Display Filter Toolbar menu. If you want to work further with the new trace file you just saved, you'll need to open it by clicking on Open in the File menu (or Open Recent in the File menu).