

In this recipe, we will learn how to start capturing data, and what we will get in various capture scenarios, after we have located Wireshark in the network.
After you install Wireshark on your computer, the only thing to do will be to start the analyzer from the desktop, program files, or the quick start bar.
When you do so, the following window will be opened (Version 1.10.2):
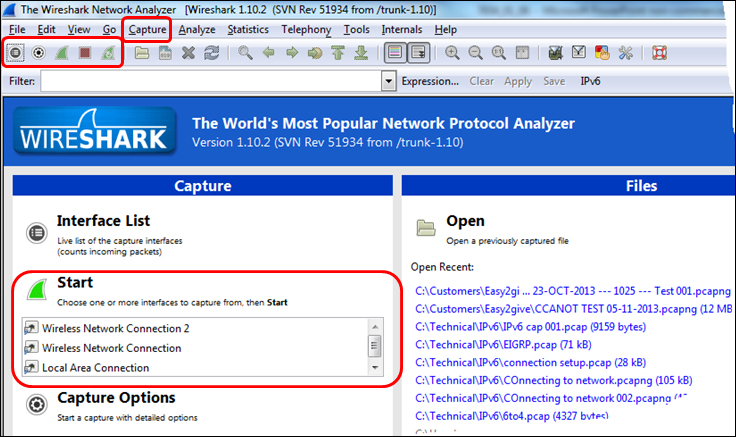
You can start the capture from the upper bar Capture menu, or from the quick-launch bar with the capture symbol, or from the center-left capture window on the Wireshark main screen. There are options that you can choose from.
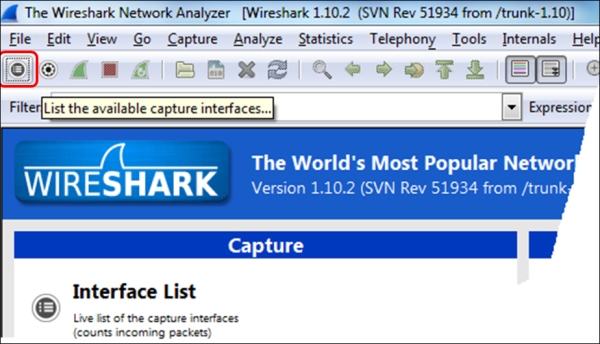
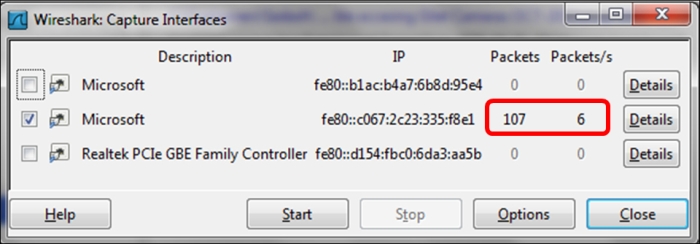
If you simply click on the green icon, third to the right, in Wireshark and start the capture, Wireshark will start the capture on the default interface as configured in the software (explained later in the chapter in the recipe Configuring the user interface in the Preferences menu). In order to choose the interface you want to capture on, click on the List the available capture interfaces symbol, and the Wireshark Capture Interfaces window will open.
The best way to see which interface is active is simply to look at the right of the window of the interface on which you see the traffic running. There you will see the number of total Packets seen by Wireshark, and the number of Packets/sec in each interface.
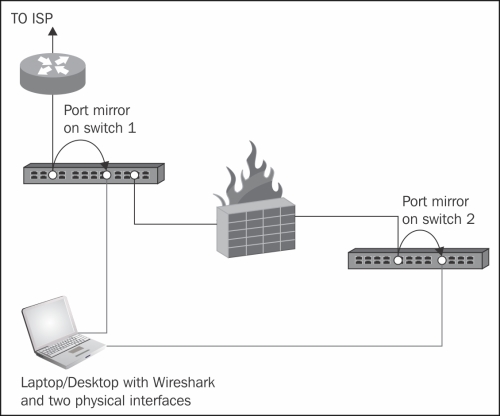
In Wireshark Version 1.10.2 and above, you can choose one or more interfaces for the capture. This can be helpful in many cases; for example, when you have multiple physical NICs, you can monitor the port on two different servers, two ports of a router, or other multiple ports at the same time. A typical configuration is seen in the following screenshot:
To configure the interface you capture data from, choose Options from the Capture menu. The following window will appear:
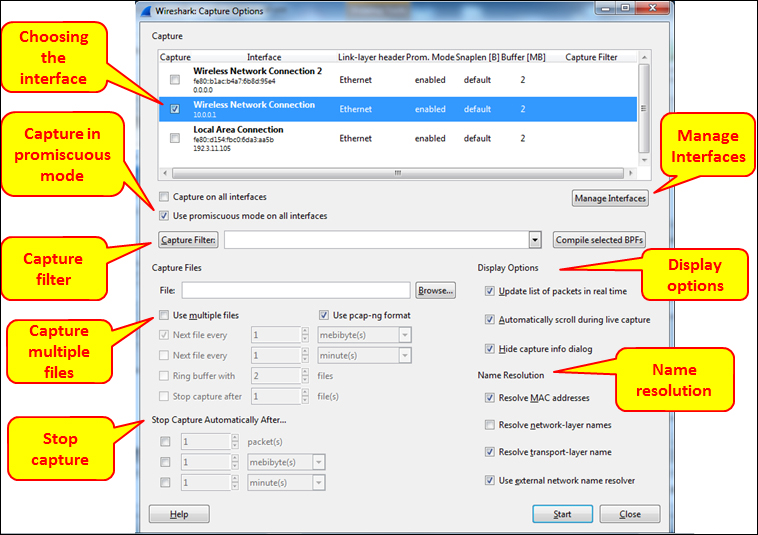
In the preceding window you can configure the following parameters:
On the upper side of the window, choose the interface you want to capture the data from.
On the left side of the window, you have the checkbox Use promiscuous mode on all interfaces. When checked, Wireshark will capture all the packets that the computer receives. Unchecking it will capture only packets intended for the computer.
In some cases, when this checkbox is checked, Wireshark will not capture data in the wireless interface; so if you start capturing data on the wireless interface and see nothing, uncheck it.
On the mid-left area of the window, you have the Capture Files field. You can write a file name here, and Wireshark will save the captured file under this name, with extensions 0001, 0002, and so on under the path you specify. This feature is extremely important when capturing a large amount of data; for example, when capturing data over a heavily-loaded interface, or over a long period of time. You can tell the software to open a new file after a specific interval of time, file size, or number of packets.
On the bottom left of the window, you have the area marked as Stop Capture Automatically in the preceding screenshot. In this area, you can tell the software to stop capturing data after a specific interval of time, file size, or number of packets.
On the mid-right area of the window, you can change the Display option and select the checkboxes Update list of packets in real time, Automatically scroll during live capture, and Hide capture info dialog, which close the annoying capture window (a pop up that appears the moment you start capture). In most of the cases you don't have to change anything here.
On the bottom right of the window, you configure the resolving options for MAC addresses, IP DNS names, and TCP/UDP port numbers. The last checkbox, Use external network name resolver, uses the system's configured name resolver (in most of the cases, DNS), to resolve network names.
Here the answer is very simple. When Wireshark is connected to a wired or wireless network, there is a software driver that is located between the physical or wireless interface and the capture engine. In Windows we have the WinPcap driver, in Unix platforms the Libpcap driver, and for wireless interfaces we have the AirPcap driver.
In cases where the capture time is important, and you wish to capture data on one interface or more, and be time-synchronized with the server you are monitoring, you can use Network Time Protocol (NTP) to synchronize your Wireshark and the monitored servers with a central time source.
This is important in cases when you want to go through the Wireshark capture file in parallel to a server logfile, and look for events that are shown on both. For example, if you see retransmissions in the capture file at the same time as a server or application error on the monitored server, you will know that the retransmissions are because of server errors and not because of the network.
The Wireshark software takes its time from the OS clock (Windows, Linux, and so on) For configuring the OS to work with a time server, go to the relevant manuals of the operating system that you work with.
In Microsoft Windows7, configure it as follows:
Go the Control Panel.
Choose Clock, Language, and Region.
Under Date and Time, Choose Set the time and date and change to the Internet time tab.
Click on the Change Settings button.
Change the server name or the IP address.
Note
In Microsoft Windows7 and later versions, there is a default setting for the time server. As long as all devices are tuned to it, you can use it as any other time server.
NTP is a network protocol used for time synchronization. When you configure your network devices (routers, switches, FWs, and so on) and servers to the same time source, they will be time synchronized to this source. The accuracy of the synchronization depends on the accuracy of the time server that is measured in levels or stratums. The higher the level, the more accurate it will be. Level 1 is the highest. Usually you will have levels 2 to 4.
NTP was first standardized in RFC 1059 (NTPv1), and then in RFC 1119 (NTPv2); the common versions in the last years are NTPv3 (RFC1305) and NTPv4 (RFC 5905).
You can get a list of NTP servers on various web sites, among them http://support.ntp.org/bin/view/Servers/StratumOneTimeServers and
You can get more information about Pcap drivers at:
For WinPcap visit: http://www.winpcap.org
For Libpcap visit: http://www.tcpdump.org