
If you have never worked with SQL Server Profiler, this recipe will teach you how to create and start your first SQL Trace. There is some detailed information on SQL Trace in There's more... section of this recipe. This will help you in appreciating rest of the recipes quite easily, which employs SQL Trace in remaining chapters. The section covers the information that will help you in mastering core concepts of SQL Trace and thus mastering SQL Server Profiler. There are no major changes in SQL Server Profiler 2012 documented. In SQL Server 2012, the architecture and functionality of SQL Server Profiler is almost identical to that of SQL Server 2008.
In this recipe, we will create our first trace with SQL Server Profiler. The following are the prerequisites that you should fulfil:
An instance of SQL Server 2012 Developer or Enterprise Evaluation edition.
An SQL Server Login account with administrative rights.
Sample AdventureWorks2012 database on the instance of SQL Server. For more details on how to install AdventureWorks2012 database, please refer to the Introduction section of this book.
To create a new trace, follow the steps provided here.
Start SQL Server Profiler. To start SQL Server Profiler, navigate through Start | All Programs | Microsoft SQL Server 2012 Program Group | Performance Tools | SQL Server Profiler.
Select New Trace... from the File menu. In the Connect to Server dialog box, provide connection details of SQL Server hosting AdventureWorks2012 database and click on Connect.
In the General tab of the Trace Properties dialog box, specify
CreatingTraceWorkloadas trace name. Use the Standard (default) trace template for the Use the template: option.Check the checkbox Save to file: and specify a path and file name in the Save As dialog box and then click on Save.
Keep Enable file rollover checked and Set maximum file size (MB): to its default value, that is,
128. The following screenshot shows the General tab of the Trace Properties dialog box:
Tip
In the Trace Properties dialog box, there is a checkbox option in the General tab with the caption Server processes trace data, to specify whether trace data should be processed on the server. If not checked, trace data is processed at the client side.
When trace data is processed at the client side, it is possible for some events to be missed if the server load is high. If this option is checked, then trace data is processed on the server and all the events included in trace definition are guaranteed to be captured without miss. However, this guarantee comes with performance penalty, because processing trace data on server has an impact on the performance of SQL Server, and hence enabling this option is not recommended on production server.
Also, running SQL Server Profiler on production server itself should be avoided as running SQL Server Profiler is resource consuming. Instead, you should run SQL Server Profiler from a client computer and connect it to your SQL Server from there.
Click on the Events Selection tab. On this screen, the events that are predefined for the Standard (default) trace template are selected and shown in grid. Check the Show all events check box to show all events.
Navigate through the Events list until you find Stored Procedures event category. Expand Stored Procedures event category if it is collapsed. Uncheck the checkbox for RPC:Completed event and check the checkbox for SP:Completed event. Uncheck the Show all events checkbox to show only selected events. The screen should now look as shown in following screenshot:

Click on the Run button to start the trace.
Now open SQL Server Management Studio and establish a connection to the same SQL Server.
In query window, type the sample T-SQL statements as shown in following script and then execute them by pressing the F5 key:
USE AdventureWorks2012
GO
SELECT DB_ID()
GO
EXECUTE sp_helpdb
GO
SELECT
P.FirstName + ' ' + P.LastName AS EmployeeName
,E.JobTitle
,E.BirthDate
,E.Gender
,E.BirthDate
FROM HumanResources.Employee AS E
INNER JOIN Person.Person AS P
ON E.BusinessEntityID = P.BusinessEntityID
GO
Now switch to the SQL Server Profiler window and stop the trace by clicking Stop selected trace button in toolbar. Observe the events captured in the trace. The following screenshot shows the captured events that are displayed in SQL Server Profiler:

We started to configure a trace by setting a few trace properties. To demonstrate how we can use one of the in-built trace templates to get a quick start, we used the default trace template Standard (default) in this example. When this template is used, the following events are selected by default:
Audit LoginAudit LogoutExistingConnectionRPC:CompletedSQL:BatchCompletedSQL:BatchStarting
Note
You may notice some TextData appearing multiple times in a trace for a single execution of a T-SQL statement. For instance, in the previous example, you will notice two events for SELECT DB_ID() statement even if we executed it only once. These two entries here do not represent two executions of the said statement. Rather, they represent two different related events associated to one single execution of the statement. For example, both events SQL:BatchStarting and SQL:BatchCompleted raised for a single execution of batch containing SELECT DB_ID() statement and they both show the same T-SQL command in TextData data column. This depends upon what events you have selected in trace definition.
In the Trace Properties dialog box, we have set the maximum file size for our trace to 128 MB. Option Enable file rollover was also enabled by default. Enabling this option is helpful while working with large amount of trace data.
When large amount of event data is captured, the trace file can grow very quickly and become very large. Enabling the Enable file rollover option can prevent a trace file from becoming very large by limiting a file to the maximum file size specified. When the file size is reached to the maximum file size specified, SQL Server creates a new roll-over file with the same name appended with a suffix of an incremental number for the same trace. Thus, when we have this option enabled and the size of trace data is greater than maximum file, we have multiple trace files for the same trace.
In this example, we are saving our trace file as C:\MyTraces\CreatingTraceWorkload.trc. A trace can also be started without having to save the trace data. In case a trace was started in this way without enabling the Save to file: checkbox, SQL Server manages to keep the captured data in queue temporarily. The unsaved trace data can be saved later on as well after gathering the required data. This can be done with the Save or Save As command from the File menu. With the Save As command, we can save trace data in our desired format. Selecting the Trace Table... option in the Save As command, asks for the SQL Server connection details and destination table details where the trace data will be stored.
It's best to store the trace file on a separate disk other than the one which is used to store data files and log files of SQL server databases. Storing the trace file on the same physical disk where database files are stored can degrade the performance of normal I/O operations of other databases.
Tip
Configuring a trace by enabling the Save to table checkbox in the Trace Properties dialog box and saving trace data directly to trace table is less efficient. If you want your trace data to be saved in a trace table then consider saving the trace data first in a trace file; then export your trace data from trace file to trace table by opening the trace file in SQL Server Profiler and selecting the Save As command from the File menu with the Trace Table... option. When you want to save your trace in a trace table, always consider to save your trace in a separate database.
The Events Selection tab of Trace Properties dialog box displays the selected events only and does not show all events by default. So, we checked the Show all events option to list all the available events. Because we did not want to capture RPC:Completed event, we excluded this event by un-checking its checkbox from the event list and included SP:Completed event under Stored Procedures event category.
Once we finished configuring our trace, the trace was started. To demonstrate how the events are captured, we produced some events by executing a few T-SQL statements from another connection through SQL Server Management Studio.
In the final figure, we can see the trace data that is produced by the events included in trace definition. Look at the trace data that we captured. By looking at the values in different data columns, we can learn many different things. For example, for a given trace, by examining LoginName, TextData, and HostName we can tell who is running which query and from which machine. By examining StartTime and EndTime data columns we can determine when a particular query was executed and when it finished its execution.
Tip
Pausing and Stopping a trace
Once a trace is started, it can be either paused or stopped. To do this, select the Run Trace, Pause Trace, and Stop Trace commands from the File menu or click on the corresponding shortcut command buttons on standard toolbar.
Pausing and resuming trace: When a trace is paused, event data stops from being captured temporarily. Once a trace is paused, it can be resumed by starting it again. Restarting a trace resumes and continues to capture event data again without wiping out any previously captured trace data.
Stopping and restarting trace: When a trace is stopped, event data stops from being captured. If a trace is stopped, it can be restarted by starting it again. Restarting a stopped trace starts to capture event data again; but any previously captured trace data is lost.
Remember that we cannot change the Trace Properties of a trace while it is running. To do this, we must have to pause or stop the trace.
This section covers some essential information on SQL Trace that you must know if you want to master SQL Tracing. It is advised that even if you are an advanced user, you do not skip this section.
Follow this section in order to have an in-depth understanding of SQL Trace and its architecture.
Understanding the SQL Trace and its architecture by knowing its related terms and concepts is a prerequisite for working with SQL Server Profiler effectively. This section discusses the basic terminologies and concepts of SQL Trace in brief.
SQL Trace is an event monitoring and capturing engine that comes with SQL Server. It provides the capability to capture the database events with event data and create traces that can be used for performance analysis afterwards.
SQL Server Profiler is a graphical user interface tool for working with SQL Trace. Behind the scene, it uses the same SQL Trace engine, but additionally provides graphical user interface to the user for working with traces. SQL Server Profiler provides functionalities, such as displaying collected event data on its graphical interface, saving traces either in a file or in an SQL Server table, opening previously saved traces, extracting T-SQL statements from a trace, and many more. Finding and analyzing long running or costly queries, finding deadlocks and their related information, looking for which indexes are scanned, and looking for database connection requests are some of the practical applications of SQL Server Profiler.
In context of SQL Trace terminology, an event is the happening of a database activity that takes place within an instance of SQL Server. Execution of an ad-hoc query or T-SQL batch, a call to stored procedure, an attempt to log in or log out from database server are a few examples that raise specific SQL Server events.
An event class describes a specific type of event. There are many different types of events that can occur within the database engine and each type of event is represented by an event class. Audit Login, Audit Logout, SP:Completed, SP:Recompile, SQL:BatchCompleted, Lock:Deadlock are some of the examples of event classes. To get list of all available event classes, you can query sys.trace_events catalog view.
An event category is a subset of related event classes. Each event class belongs to a particular event category and each event category includes a subset of specific type of event classes. Locks, performance, scans, and stored procedures are some examples of the event categories. To get list of all available event categories,you can query sys.trace_categories catalog view. You can join sys.trace_events and sys.trace_categories catalog views on category_id column to make correlation between the two views.
A data column is an attribute that represents a particular characteristic of an event class. For example, event class SQL:BatchCompleted can have different characteristics, such as TextData, LoginName, Duration, StartTime, EndTime, and so on, where TextData represents T-SQL statement(s) whose execution raises a particular event. These characteristics of event classes are represented by different data columns.
A session that performs the activity of capturing database events and collecting events' data is typically called a trace. Loosely, the term Trace is also used by database professionals to refer the Trace Data that has been collected previously during a trace session and saved in a trace file or SQL Server table.
A set of configured settings for a trace that defines how event data should be collected or saved and which event classes or data columns should be collected as a part of trace data is called Trace properties or a Trace definition.
A filter is an optional logical condition that can be applied to a trace to limit the resulting trace data by capturing only the required trace events for which the filter condition is satisfied. For example, in a trace definition we can specify a filter condition so that SQL Trace collects event data only for a specific database by applying a filter on either DatabaseID data column or DatabaseName data column.
After learning the basic SQL Trace terms and concepts, it will be easier to understand the following architectural diagram of SQL Trace:
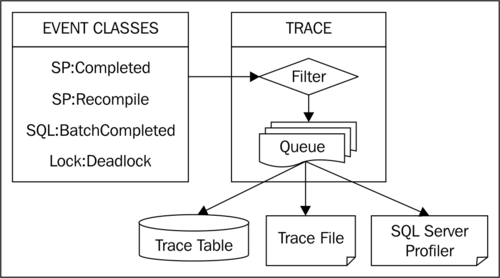
When events are raised in SQL Server database engine, SQL Trace captures event data only for those event classes that are included in trace definition and for which filter conditions if specified any are satisfied. Once the event data is captured, it is queued and then sent to its specified target location. The target location can be a Trace file, Trace table, or SQL Server Profiler. Trace data can also be viewed only in SQL Server Profiler without the need of saving a trace.
After understanding the basic concepts of SQL Trace, working with SQL Server Profiler and traces should be an easy task. As this is our first recipe of the book where we learn how to create a trace or workload with SQL Server Profiler, let's first discuss something about trace and workload.
We now know that a trace is a session during which the events are captured and event data is collected. SQL Server supports few formats for saving this collected trace data. We can save trace data in one of the following formats:
A trace file with
.trcextension nameA trace file in XML format with
.xmlextension nameA trace table in an SQL Server database
A trace contains a series of events and every event has its associated event data. All the events of a trace and their event data collectively form trace data for a trace file. Data columns associated with trace events form the event data. T-SQL statements whose execution causes the events to be raised are also a part of this event data under TextData data column and are themselves included in trace data.
A workload or workload file basically contains a series of T-SQL statements. A T-SQL script is an example of a workload file. Because trace data also contains a series of T-SQL statements as a part of event data (as TextData Column), they are also used as workloads. Thus, a T-SQL script, trace file (.trc or .xml), trace table, all can be considered as workload. In other words, a trace file is also a workload file. This workload can be used to re-run on a database for workload or performance analysis. Usually, a workload file is provided as input file to Database Engine Tuning Advisor (DTA) for a tuning session. You will learn more about Database Engine Tuning Advisor in Chapter 2, Tuning with Database Engine Tuning Advisor.
The following list gives brief descriptions of commonly used event classes:
Audit Login:This event occurs when a user connects and logs in to SQL ServerAudit Logout:This event occurs when a users disconnects and logs out from SQL ServerRPC:Starting:This event occurs when a Remote Procedure Call (RPC) starts executingRPC:Completed:This event occurs when a Remote Procedure Call (RPC) completes its executionSQL:BatchStarting:This event occurs when a T-SQL batch starts executingSQL:StmtStarting:This event occurs when a statement inside a T-SQL batch starts executingSQL:StmtCompleted:This event occurs when a statement inside a T-SQL batch completes its executionSQL:BatchCompleted:This event occurs when a T-SQL batch completes its executionSP:Starting:This event occurs when a stored procedure starts executingSP:StmtStarting:This event occurs when a statement inside a stored procedure starts executingSP:StmtCompleted:This event occurs when a statement inside a stored procedure completes its executionSP:Completed:This event occurs when a stored procedure completes its execution
The following list gives brief descriptions of commonly used event classes:
ApplicationName:This data column represents the name of the client application causing a trace event to occurDatabaseID:This data column represents the internal system assigned ID of the database for which a trace event occursDatabaseName:This data column represents the name of the database for which a trace event occursHostName:This data column represents the name of the host or computer where the client component connecting to SQL Server causes a trace event to occurLoginName:This data column represents the name of the login under whose security context, particular T-SQL statement(s) executes that causes trace event to occurObjectID:This data column represents the internal system assigned ID of an object for which a trace event occursObjectName:This data column represents the name of an object for which a trace event occursSessionLoginName:This data column represents the name of the login who initiated the connection and under whose security context a trace event occursSPID:This data column represents the Server Process ID or Session ID of the connection which causes a trace event to occur
Note
For a complete list of event classes and data columns of SQL Trace with their description, you can refer product documentation for SQL Server 2012 at msdn.microsoft.com/en-us/library/bb418432(v=sql.10).aspx.