

Now that we have set up Wireshark on our system, we can move ahead and start experimenting with its features. In this section we will cover some of the basic features and quick tips that are essential for getting started with packet capture using Wireshark. We will start with the basics of Wireshark where we will take a brief look at its GUI and later on we will experiment with packet capture and the analysis of the captured data. Meanwhile we will be using some common network protocols and terminologies such as HTTP, TCP, and data packets. Familiarity with these terms can help in a better understanding of packet capturing. So let us move ahead to start our journey with Wireshark.
The first and foremost thing to start with is selecting a network interface on which you want to capture the data. Once we have set up Wireshark on our system, we can launch it from the desktop or start menu or through the command line depending on your operating system. The first thing that Wireshark will prompt is to select a network interface. A typical Wireshark launch panel will look similar to the following screenshot:

As you can see, the top-left column of the main window displays different capture interfaces under the heading Interface List. We can select any interface of our choice to start working with. For example, to capture the LAN traffic flowing across your system, you can choose the default LAN network card installed on your system. Similarly you can select the 802.11 Ethernet adapter for wireless data capture over LAN and so on.
Once we are through with the network interface selection, we can move ahead with packet capturing but before jumping to it, let us take a quick look at the Wireshark GUI and understand the functionality of some of the useful menu items.
Looking at the previous screenshot, you can see that the main menu bar of Wireshark contains some of the commonly known menu items such as File, View, Edit, and Help. The other menu items such as Analyze and Capture will be discussed later in other sections of the book. Below the main menu bar, we have specific menu icons which are used for the quick launch of common actions performed during packet capture and analysis. Let us take a brief look at some of them.

List available capture interfaces (1): This menu icon is used to change or select a new interface media while working with packet capture.
Show capture options (2): This icon launches a mini panel to customize the data capture settings. Some of the main customizations that can be made are:
Changing the capture type
Setting up the buffer size for capture
Limiting the size of captured data
Managing display options and name resolution
Start a new live capture (3): This icon is used to launch a fresh capture from the selected interface.
Stop the running of live capture (4): This icon is used to stop the current live capture while maintaining the captured data in the buffer for further processing.
Find a packet (5): This icon is used to look for a particular text/string/parameter within the captured packets.
Edit capture filter (6): This icon is used to modify the capture filter applied to data packets. We will cover this in detail in our next section.
Note
You will also notice a Filter box under the menu icons. This box is used to quickly apply a particular filter over the captured packets. For example, we can view only the DNS request/response by typing dns in the Filter box. It also reflects the current display filter that is applied on the captured traffic.
Let us now take a quick look at the different panels present in the Wireshark GUI. Typically we can divide the GUI panels into four parts: capture panel, packet details panel, packet bytes panel, and lastly the status panel. We will go through each of these one by one.
The capture panel displays the live capturing of network packets in a sequential order. Each line in this list reflects a single captured packet. This intelligent display panel divides the information into rows and columns. Each row represents a single data packet whereas each column represents additional information about the packet.
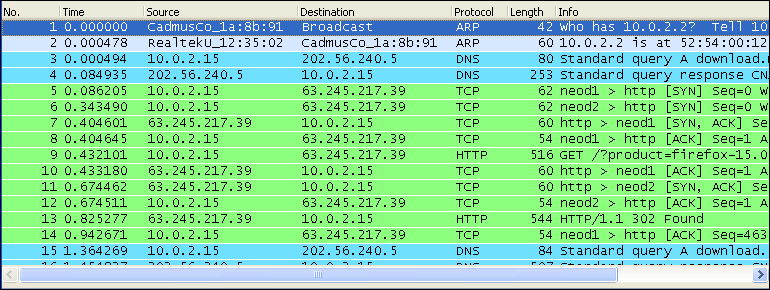
The columns are as follows:
No.: This represents the packet sequence number to identify packets uniquely
Time: This represents the time stamp when a packet is captured
Source: This represents the IP address/device from where the packet is coming
Destination: This represents the IP address/device where the packet is going to
Protocol: This represents the protocol type of the captured packet
Length: This represents the size of the packet
Info: This represents quick additional information about the packet
Whenever a single data packet is selected from the capture panel, its detailed information is shown inside the packet details panel.

It contains detailed information about the protocols and its different parameters in a tree structure which can be expanded and collapsed. This information can be helpful in network forensics.
The packet bytes panel represents the information of the packet details panel in a dump or actual format. It shows the byte sequences of the flow.

Here also the information is divided into three columns where the first column represents the data offset, the next column represents the data in hexadecimal values, and the last column represents the ASCII representation of information.
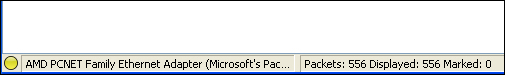
The status panel shows the current status of our operation. It reflects information such as the capture status, count of packets (captured, displayed, and/or marked), and the file location where the captured packets are stored.
We took a quick look at some of the important features in the Wireshark GUI. We will now proceed with some technical aspects of our packet capturing tool.
Here we will cover one of the most technical and useful discussions of packet capture. Filters play a very important role in packet capture. While working on a LAN or while capturing the packets on a server hosting many services, we can face problems in monitoring a particular protocol or service. To remove this overhead we use filters. Filters can be applied at two ends, namely capture filters and display filters. Let us start with capture filters.
Capture filters are applied to monitor packets selectively. It will filter out or capture only that traffic which is assigned by us. To do this selective capturing we will have to pass the winpcap command instructions to Wireshark.
The Capture filter option can be launched by clicking on the Edit Capture Filter menu icon. Alternatively, it can also be launched by clicking on Capture | Options. You will see an option window similar to the following screenshot:
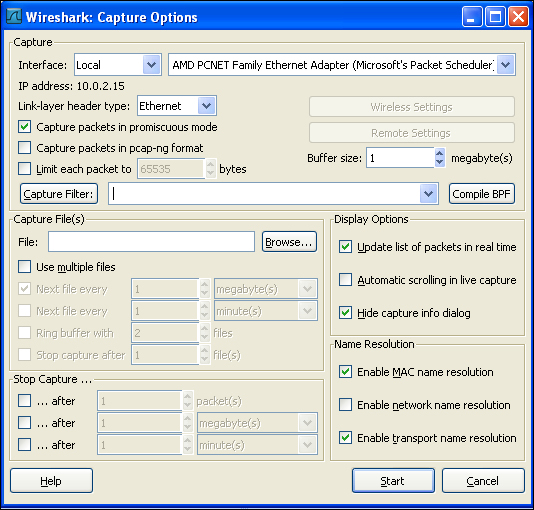
We can enter our filter options by filling in the Capture Filter field. Alternatively, we can also click on Capture Filter and store our capture filter rule for future rules.
The question that now arises is how to write a filtering rule. WinPcap rules for packet capture follow a definite pattern. A typical structure for writing a rule can be as follows:
<Protocol name><Direction><Host(s)><Value><Logical operations><Expressions>
For example, to capture TCP packets when the source port is 443, we will write the following rule:
tcp src port 443
Similarly, to drop ARP packets we can use not arp.
To capture both inbound and outbound traffic on port 80 (http), we can use port 80.
To capture packets where the source IP is 192.168.56.101 and the port number is 232 we can use src 192.168.56.101 and port 232.
In this way we can combine different conditions to create our own capture filters and reduce the overhead. If no capture filter is applied, then all the network packets flowing through the selected interface are captured by Wireshark.
The next filter option is the display filter. It is used to select particular packets from the captured file. Unlike capture filters, display filters can be applied even after the packets have been captured. The display filter menu can be launched by clicking on the Edit/Apply Display filter menu icon. Alternatively, display filter rules can also be applied using the filter bar available on the main GUI window.
Display filter rules also follow a fixed structure:
<Protocol> . <String 1> . <String 2> . <Comparison Operator><Value><Logical operators><Expressions>
Let us pick up some examples to implement this rule structure practically.
To view the TCP packets captured on port 80, we can use the following display filter:
tcp.port==80
Typing !arp and pressing Enter in the Filter bar will drop all the ARP packets.

The filter ip.addr==192.168.56.101 will display packets only from a particular IP.
Now that we have covered the hard part about packet filters, we will discuss a quick and easy way to perform both types of filter options.
The Filter Expression dialog is a feature that makes it easy for novice Wireshark users to create, capture, and display filters. It can be launched by clicking on the Expression... button present on the Filter expression bar (refer to the previous screenshot).

Using this we can easily create display/capture filters as it provides us with multiple options along with some pre-loaded expressions. To create an expression you can follow these simple steps:
To view the specific criteria fields associated with a protocol, expand that protocol by clicking on the plus [
 ] icon next to it.
Once you find your desired criteria, you can select the relation such as equal to (==) or greater than (>).
Next you can provide the value with which you want to compare (for example, google.com or a number).
If you notice the previous screenshot, the fieldname http.request.uri is selected to check if it is equal to (Relation) google.com (Value). Hence the complete filter expression becomes http.request.uri==google.com.
This was a quick demonstration of using the Filter Expression box. In the next section we will start working with our first packet capture.
Now that we have developed enough background about Wireshark, we can start with the "Hello World" of packet capturing. In this section we will take a quick look at how we can start with capturing packets using Wireshark.
To start capturing data packets in a Windows environment, follow these simple steps:
Launch Wireshark from the start menu.
Apply the desired capture filters.
Choose a network interface to start capturing the traffic.
These same steps can be repeated for launching Wireshark in Linux-based operating systems as well. The only difference lies in selecting the network interfaces as Linux shows network devices instead of network description.
Once you have selected the interface, you will notice that the capture panel starts populating with captured packets.

You can stop the live capture at any time by clicking on the Stop menu icon. A new live capture can be started by clicking on the Restart live capture option. Note that the currently captured data will be erased if we select the restart option.
You will notice different coloring schemes used by Wireshark to mark different protocols. Let us move ahead and take a quick look at this coloring scheme and how it is implemented.
You might have noticed by now the colorful scheme that Wireshark uses to distinguish different protocols. In fact the coloring scheme is used in case of a bad packet, checksum error, and other common packet errors that may occur in a network.
To take a closer look at the coloring scheme, click on the Edit coloring rules... from the menu icons. This will launch a menu box reflecting the default coloring scheme.

You will notice different default coloring patterns used to represent protocols, errors, failures, and so on. The default scheme can also be changed to being user specific by clicking on the Edit button.

This will provide you with the flexibility to change the different coloring schemes such as background color, foreground color, name to represent the protocol, and string pattern.
The main reason for packet capture is to analyze the network activity. Captured packets can be analyzed very effectively using Wireshark. Let us continue from our previous discussion where we learnt about performing a live capture. Let us click on the Stop live capture menu icon and begin our experimentation with captured packets.
Searching for specific information can be carried out by navigating to Edit | Find Packets or by pressing the Ctrl + F keys. This will launch a search box with three different search options, namely Display filter, Hex value, and String.
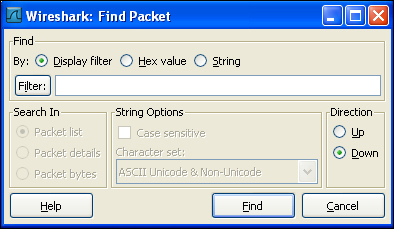
The Display filter option allows us to enter an expression-based filter that will find only those packets that satisfy that expression.
The Hex value search option is used to look for a specific hexadecimal sequence.
The String search option allows us to look for specific strings. Searching for specific strings activates another supporting search option listed under the Search In table. To search for a particular string from the list of captured packets, we can select the Packet list option. To look for a particular string type that can exist in the packet header information, we can use the Packet bytes option. Finally to search for a string inside the data contained by the packet, we can use the Packet details option.
Marking important packets can be useful in quickly retrieving the required information. This can be helpful in keeping track of important packets in a huge list of captured data. To mark any packet, right-click on it and select Mark Packet (toggle). The background color of the marked packet changes to solid black for visual identification.

To save the captured file, go to File | Save as. Here we will have an option to either save all the captured packets or selectively save only the displayed packets after applying some display filter. Wireshark supports various packet capture file formats such as .pcap, .cap, and .pcapng.
Wireshark also allows the exporting of the captured packets into different formats such as .txt, .csv, and .xml. This feature is helpful when the data is to be used in other operations. Packets can be exported by going to File | Export | File.
Wireshark also provides the feature of merging different capture files into one. To merge a capture file, follow these steps:
Open one of the capture files you want to merge.
Choose File | Merge to bring up the Merge with Capture File dialog.

Select the new file you wish to merge into the already open file, and then select the method to use for merging the files. You can prepend the selected file to the currently open one, append it, or merge the files chronologically based on their timestamps.
Wireshark allows the printing of captured packets as plain text, post script, or to an output file depending on your choice. It also allows you to provide a specific range of packet numbers for selective printing. Navigating to File | Print will launch the print box.
This was a brief demonstration of working with captured packets to enhance productivity. In the next section we will focus on some other lesser known features of Wireshark which can be essential during packet forensics and network penetration testing.
Wireshark also provides a cool feature to quickly develop a graphical overview of our captured packets. This can be helpful in monitoring the amount of data flowing across the network. Graphical analysis can also be helpful in analyzing large amounts of data. To generate a graphical view of your captured file, go to Statistics | IO Graph.

There are different operations that can be performed with this graph.
We can enable five different comparison graphs and provide them with different coloring schemes for easy viewing.
We can also filter out packets from our analysis to build specific graphs. Clicking on Filter will open the same menu box which we have seen earlier in our Setting up filters section.
Style provides us with the flexibility to choose from different graph options that we can build (Line/Impulse/FBar/Dot).
The graph co-ordinates, that is, the X Axis and the Y Axis, can also be modified accordingly.
X Axis
Tick interval: An interval in the X direction lasts (10/1) minutes or (10/1/0.1/0.01/0.001) seconds
Pixels per tick: Uses 10/5/2/1 pixels per tick interval
View as time of day: Gives the option to view the X direction labels as time of day instead of seconds or minutes since beginning of capture
Y Axis
Unit: The unit for the Y direction (Packets/Tick, Bytes/Tick, Bits/Tick, and Advanced)
Scale: The scale for the Y unit (Logarithmic, Auto, 10, 20, 50, 100, and so on)
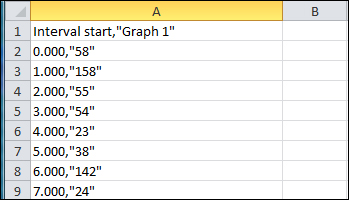
The Copy option can be used to copy the values of packets directly from the graph and paste them into a CSV file. A typical CSV file will look similar to the one shown as follows:
The Save option enables us to save the graph in several image formats such as JPG, PNG, and BMP.
We have already seen several operations on data packets in the Working with captured packets section. Here we will throw some light on various file formats and different importing/exporting techniques that can be helpful for us in understanding Wireshark in detail. So let us start with a basic discussion of opening a captured data packet.
To open the captured packet, move to File | Open. This will launch the file selection panel from where we can select the file we want to open.

In this way we can open and perform various operations on the captured packets which we have discussed so far. We have already discussed about saving and merging different captured files in our previous sections. An important thing to discuss here is the different file formats supported by Wireshark. Let us take a quick look at them.
Wireshark supports a wide range of file formats to open or save data packets. This is one of the major reasons which makes Wireshark the most popular packet capture tool. Packets saved from other tools can also be opened inside Wireshark, and it can save the captured packets in several formats so that other tools can also understand and analyze them. We will look at different input and output formats supported by Wireshark in this section.
Wireshark supports over 30 different tools to seamlessly open their captured files. Some of them are:
Libpcap: This is the most widely used file format for network captures. Products which save captured network packets as libpcap are Wireshark, tcpdump, psniff, and so on
Microsoft network monitor (Netmon): This is a network capture tool from Microsoft
Network Associates Windows-based Sniffer: Files generated using Microsoft sniffers
Symbian OS btsnoop captures: These are Symbian-based sniffing tools
IBM Series (OS/400) Comm traces: These are sniffing tools designed to work with IBM devices
Pcap-ng: This is the successor of libpcap with several modifications and added features
Some of the other vendors supported by Wireshark include Juniper, HP, Toshiba, and RADCOM.
Now let us move to some of the important file formats in which Wireshark can save the packets.
libpcap, tcpdump, and various other tools using tcpdump's capture format
Microsoft Network Monitor - NetMon (*.cap)
Network Associates Sniffer (*.cap)
Pcap-ng
This was a quick reference to some of the important file formats supported by Wireshark. This information can be helpful during file import and export. Let us move ahead with another important discussion about file input/output.
Expert Info is another powerful feature of Wireshark that helps in keeping track of any abnormality that may arise in packet capture. It keeps a log of all the packets and provides an approximate intelligent analysis. The information includes reporting, error, failure, protocol, and severity. Let us take a close look at how we can leverage the power of Expert Infos.
To launch the Expert Infos dialog, go to Analyze | Expert info Composite.
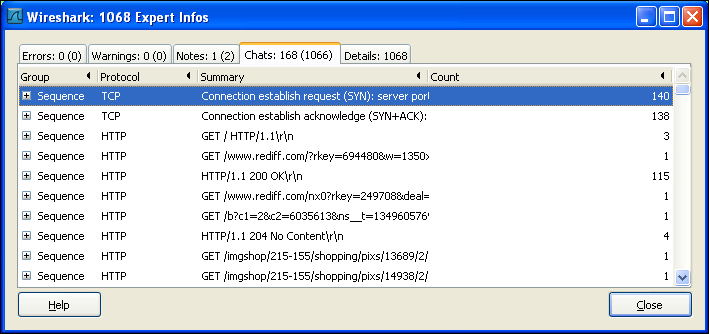
You will notice five different tabs at the top. Let us define their purpose one by one:
Errors: This tab reports about any error that may have a risen during packet capture
Warnings: This Expert Info gives warning information such as segmentation error and out of order packets
Notes: This tab gives approximate information in case of duplicate packets, protocol issues, and so on
Chats: This tab gives us information about communication calls such as TCP GET request and application calls
Each tab discussed earlier contains a separate information table that displays information contained in the tabs. This information table contains four columns, namely Group, Protocol, Summary, and Count. Some older versions of Wireshark can also contain a fifth row named Severity. Let us define them in a nutshell.
Group: This Expert Info tells us about the category under which the information has been categorized. The different categories include checksum, sequence, and request/response code.
Protocol: This represents the protocol for which the Expert Info has been reported.
Summary: This gives short additional information about the Expert Info.
Count: This represents the packet position in the entire file.
This is a quick demonstration of using Expert Infos for better network analysis. But this is not the only way in which Wireshark provides expert analysis. We can also view this information directly on the main capture panel. To add to this column, we will have to use the Preferences option. Let us discuss this in detail in our next section.
Preferences can be used to set up our own display and monitor options. This enhances the capability of Wireshark beyond the default settings and the user can directly view those things which are important for his/her analysis. To bring up the Preferences box, navigate to Edit | Preferences….
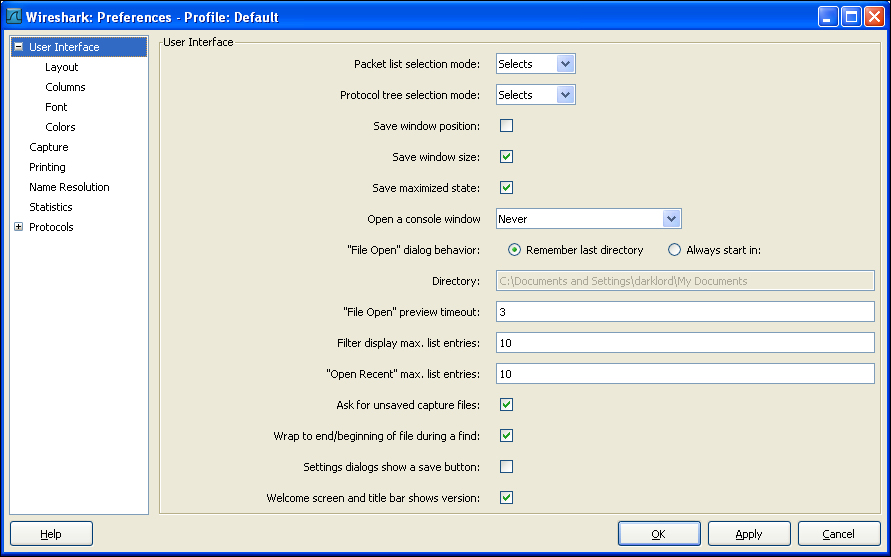
You can modify and add several different view options from this window. Let us move ahead and add the expert column to our capture panel.
Select the Columns option from the left panel.
In the properties column (center bottom) click on the Add button. This will create a new column entry. From the Field Type drop-down menu, select Expert Info Severity.

Click on the Add button to enable this column view. You can rename the column by clicking on it and entering the name of your choice.
Once you are done with these three steps you will notice that an extra column with Expert Infos has been added in your capture panel.

This was a short description of using the preferences option to change the default view according to your choice. You can explore the other possibilities by changing the preferences of color, font, display protocols, and so on.
These were some of the kick-starter sections to get you started with Wireshark and packet capture. By now we have covered most of the basic and some advanced topics that are essential to understand the working of Wireshark. In the next section of this Starter guide we will cover some top features that can be very helpful for your packet analysis if you want to dive even deeper into the tool.