Sign In Start Free Trial
Account

Add to playlist

Create a Playlist

Modal Close icon
You need to login to use this feature.
  • Book Overview & Buying SAP BusinessObjects Dashboards 4.1 Cookbook
  • Table Of Contents Toc
  • Feedback & Rating feedback
SAP BusinessObjects Dashboards 4.1 Cookbook

SAP BusinessObjects Dashboards 4.1 Cookbook

By : David Lai
4.9 (8)
close
close
SAP BusinessObjects Dashboards 4.1 Cookbook

SAP BusinessObjects Dashboards 4.1 Cookbook

4.9 (8)
By: David Lai

Overview of this book

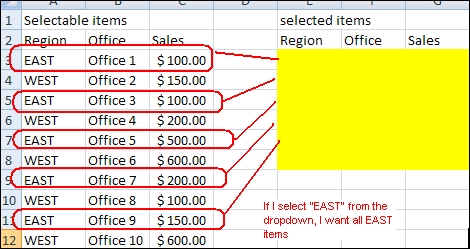
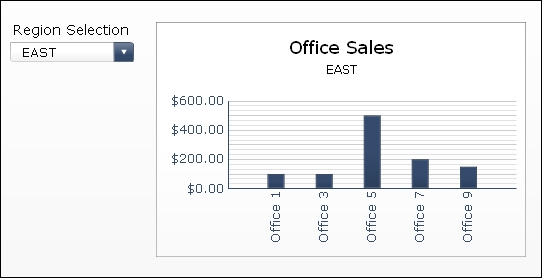
If you are a developer with a good command and knowledge of creating dashboards, but are not yet an advanced user of SAP BusinessObjects Dashboards, then this is the perfect book for you. Prerequisites include a good working knowledge of Microsoft Excel as well as knowledge of basic dashboard practices.
Table of Contents (17 chapters)
close
close
16
Index

Using Filtered Rows


Filtered Rows was one of the greatest additions to Xcelsius 2008 (now SAP BusinessObjects Dashboards 4.1) from Xcelsius 4.5. If we look at the following screenshot, we see that we have a set of Sales metrics that are grouped by Region and Office:

Let's say we want to be able to select a region and show a sales comparison chart between the different sales offices of that region. Before the advent of Filtered Rows, we would have had to perform a complex VLOOKUP or have the result come back through a query every time a region was selected. Both methods are very time consuming.

How to do it...

  1. We will use a Combo Box selector to choose the desired region.

  2. In the Combo Box selector properties, bind the Labels to the Region column.

  3. Select Filtered Rows as the Insertion Type. Bind Source Data to cells A3:C12. The Destination will contain the chart values as well as the selected region.

  4. Bind the chart values to the Destination section from step 3.

How it works...

The Filtered Rows insertion...

Visually different images
CONTINUE READING
83
Tech Concepts
36
Programming languages
73
Tech Tools
Icon Unlimited access to the largest independent learning library in tech of over 8,000 expert-authored tech books and videos.
Icon Innovative learning tools, including AI book assistants, code context explainers, and text-to-speech.
Icon 50+ new titles added per month and exclusive early access to books as they are being written.
SAP BusinessObjects Dashboards 4.1 Cookbook
notes
bookmark Notes and Bookmarks search Search in title playlist Add to playlist font-size Font size

Change the font size

margin-width Margin width

Change margin width

day-mode Day/Sepia/Night Modes

Change background colour

Close icon Search
Country selected

Close icon Your notes and bookmarks

Confirmation

Modal Close icon
claim successful

Buy this book with your credits?

Modal Close icon
Are you sure you want to buy this book with one of your credits?
Close
YES, BUY

Submit Your Feedback

Modal Close icon
Modal Close icon
Modal Close icon