
With SAP BusinessObjects Dashboards, we can create tables that look just like a table in an Excel spreadsheet. Unfortunately, our everyday tables look quite bland. If we start off with a default spreadsheet table, it will look kind of like this:
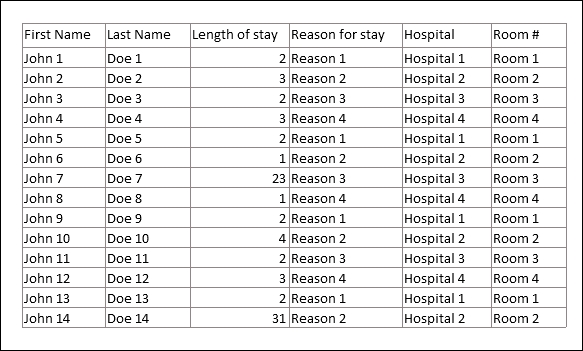
It looks okay, but with the help of some additional objects, we can spice it up to look a bit more attractive.
Prepare the data on your Excel spreadsheet and set up a Spreadsheet Table component as shown in the previous screenshot.
Add color to the row header, and make the header text bold.

In the Spreadsheet Table component properties, rebind Display Data to the corresponding cells (A1:F15) so that the updated header text format will show up. Go to the Appearance category and uncheck Show Gridlines.

Change the theme to Aero.
Select the first Background object from the Art and Backgrounds tab from the Category window. Place the background so that it is under the table.
Select Label from the Text tab...