Book Image

Mastering QGIS - Second Edition

By : Kurt Menke, GISP, Paolo Corti, Richard Smith Jr., GISP, Luigi Pirelli, John Van Hoesen, GISP
Book Image

Mastering QGIS - Second Edition

By: Kurt Menke, GISP, Paolo Corti, Richard Smith Jr., GISP, Luigi Pirelli, John Van Hoesen, GISP

Overview of this book

QGIS is an open source solution to GIS. It is widely used by GIS professionals all over the world. It is the leading alternative to the proprietary GIS software. Although QGIS is described as intuitive, it is also by default complex. Knowing which tools to use and how to apply them is essential to producing valuable deliverables on time. Starting with a refresher on the QGIS basics, this book will take you all the way through to creating your first custom QGIS plugin. From the refresher, we will recap how to create, populate, and manage a spatial database. You’ll also walk through styling GIS data, from creating custom symbols and color ramps to using blending modes. In the next section, you will discover how to prepare vector, heat maps, and create live layer effects, labeling, and raster data for processing. You’ll also discover advanced data creation and editing techniques. The last third of the book covers the more technical aspects of QGIS such as using LAStools and GRASS GIS’s integration with the Processing Toolbox, how to automate workflows with batch processing, and how to create graphical models. Finally, you will see how to create and run Python data processing scripts and write your own QGIS plugin with pyqgis. By the end of the book, you will understand how to work with all the aspects of QGIS, and will be ready to use it for any type of GIS work.
Table of Contents (19 chapters)
Mastering QGIS - Second Edition
Credits
Foreword
About the Authors
About the Reviewer
www.PacktPub.com
Preface
Index

Viewing a statistical summary of vector layers


It is often useful to have an at-a-glance view of a vector layer's statistics when you are working on a project. QGIS has a Statistics Panel that allows you to view a long list of descriptive statistics for whichever vector layer you choose. In this section, we will review the capabilities of the statistical summary tool in QGIS.

To open the statistical summary tool, either click View | Statistical Summary or View | Panels | Statistics Panel. This will open the Statistics Panel, shown in the following screenshot. Like all other panels, it can float on the screen, or be set to dock, so you may need to search your screen to find the panel:

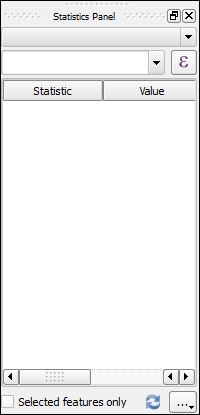
The Statistics Panel is not that exciting without data to summarize, so we will use the Counties.shp file from the sample data:

  1. Add Counties.shp to the QGIS project.

  2. In the Statistics Panel, choose Counties in the top combo box, then choose CattleCalv in the field selector box.

The statistical summary for the number...