Book Image

Salesforce Lightning Reporting and Dashboards

By : Johan Yu
Book Image

Salesforce Lightning Reporting and Dashboards

By: Johan Yu

Overview of this book

Built on the Salesforce App Cloud, the new Lightning Experience combines the new Lightning Design System, Lightning App Builder, and Lightning Components to enable anyone to quickly and easily create modern enterprise apps. The book will start with a gentle introduction to the basics of Salesforce reports and dashboards. It will also explain how to access reports in depth. Then you will learn how to create and manage reports, to use Schedule Report, and create advanced report configurations. The next section talks about dashboards and will enable you to understand and compare various types of dashboard component and how you can benefit the most from each of them. Then we move on to advanced topics and explain tips and tricks related to reports and dashboards, including reporting snapshots, report parameters, and collaboration. Finally, we will discuss how to access dashboards and reports from the Salesforce1 mobile app.
Table of Contents (13 chapters)

Navigating to a report

When you open a report, what items can we customize in the report result without edit the report? The following screenshot is taken from a pipeline report in Lightning experience:

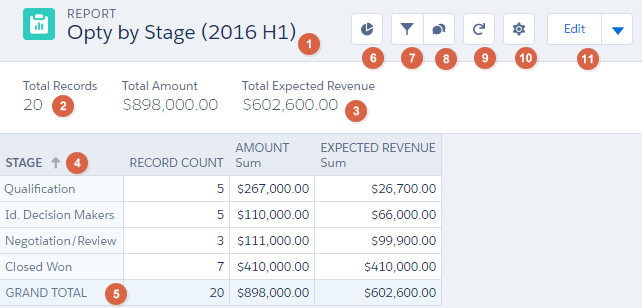
Let's start by looking all the components in a :

  1. Title: This is purely just the report title that is derived from report name, and when you change the report name, the title will automatically follow.
  2. Total Records: This is the number of records returned by the report. You can hide this by disabling Record Count under Settings (the gear icon), as shown in the preceding screenshot.
  3. Summarize: For each field's summarization, the total will be shown here. If a field has two summarize options configured, such as Sum and Average, you will see two values for the same field. You can hide these values from Settings (the gear icon) marked with number 10 in the preceding screenshot...