Book Image

Rust Programming Cookbook

By : Claus Matzinger
Book Image

Rust Programming Cookbook

By: Claus Matzinger

Overview of this book

Rust 2018, Rust's first major milestone since version 1.0, brings more advancement in the Rust language. The Rust Programming Cookbook is a practical guide to help you overcome challenges when writing Rust code. This Rust book covers recipes for configuring Rust for different environments and architectural designs, and provides solutions to practical problems. It will also take you through Rust's core concepts, enabling you to create efficient, high-performance applications that use features such as zero-cost abstractions and improved memory management. As you progress, you'll delve into more advanced topics, including channels and actors, for building scalable, production-grade applications, and even get to grips with error handling, macros, and modularization to write maintainable code. You will then learn how to overcome common roadblocks when using Rust for systems programming, IoT, web development, and network programming. Finally, you'll discover what Rust 2018 has to offer for embedded programmers. By the end of the book, you'll have learned how to build fast and safe applications and services using Rust.
Table of Contents (12 chapters)

Debugging Rust

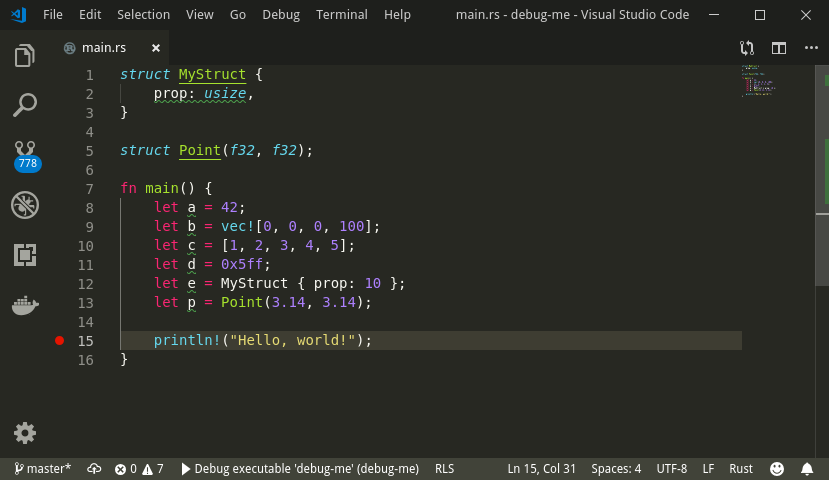
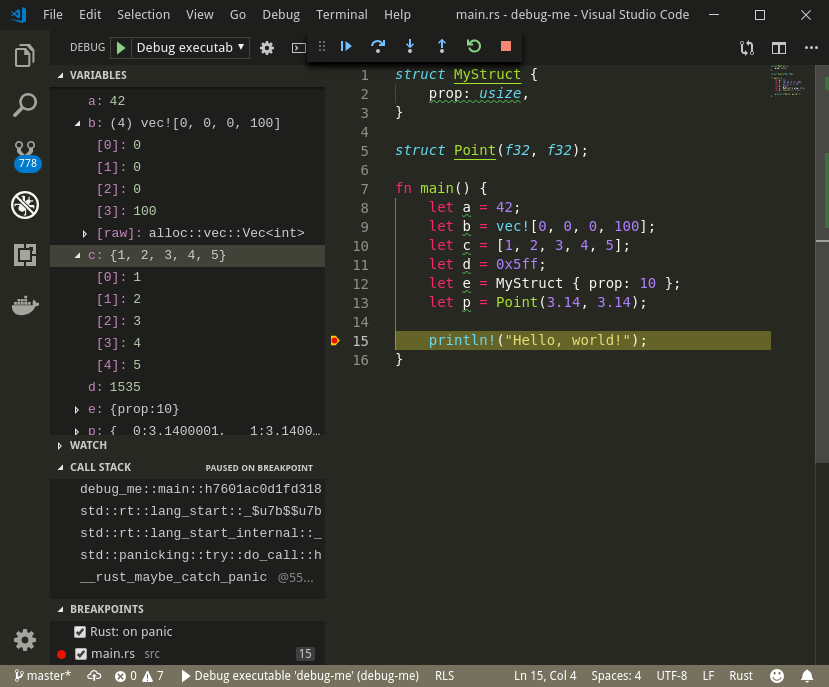
Debugging has been a notoriously difficult topic in Rust, but still, it pales in comparison to Visual Studio debugging or IntelliJ IDEA's (https://www.jetbrains.com/idea/) capabilities in the Java world. However, debugging capabilities go beyond simple println! statements nowadays.

Getting ready

Debugging Rust is available via an additional extension in Visual Studio Code. Install it by running ext install vadimcn.vscode-lldb in the command window (Ctrl + P/cmd + P).

On Windows, debugging is limited thanks to its incomplete LLVM support. However, the extension will prompt you to automatically install several things. Additionally, install Python 3.6 and add it to %PATH%. With these dependencies installed, it worked well for us (in March 2019).

Read more at https://github.com/vadimcn/vscode-lldb/wiki/Setup.

How to do it...

Execute the following steps for this recipe:

  1. Create a new binary project to debug: cargo new debug-me. Open this project in Visual Studio Code with the new extension loaded.
  2. Before anything can happen, Visual Studio Code needs a launch configuration to recognize Rust's LLVM output. First, let's create this launch configuration; for that, add a .vscode directory containing a launch.json file to the project directory. This can be autogenerated, so make sure that launch.json contains the following:
{
"version": "0.2.0",
"configurations": [
{
"type": "lldb",
"request": "launch",
"name": "Debug executable 'debug-me'",
"cargo": {
"args": [
"build",
"--bin=debug-me",
"--package=debug-me"
],
"filter": {
"kind": "bin"
}
},
"args": [],
"cwd": "${workspaceFolder}"
},
{
"type": "lldb",
"request": "launch",
"name": "Debug unit tests in executable 'debug-me'",
"cargo": {
"args": [
"test",
"--no-run",
"--bin=debug-me",
"--package=debug-me"
],
"filter": {
"kind": "bin"
}
},
"args": [],
"cwd": "${workspaceFolder}"
}
]
}
  1. Now, let's open src/main.rs and add some code to debug:
struct MyStruct {
prop: usize,
}

struct Point(f32, f32);

fn main() {
let a = 42;
let b = vec![0, 0, 0, 100];
let c = [1, 2, 3, 4, 5];
let d = 0x5ff;
let e = MyStruct { prop: 10 };
let p = Point(3.14, 3.14);

println!("Hello, world!");
}

  1. Save and add a breakpoint in VS Code's user interface. Click left of the line numbers and a red dot should appear there. This is a breakpoint:

  1. Having set a breakpoint, we expect the program to pause there and give us some insights into the current memory layout, that is, the state of any variables at that particular point in time. Run the debug launch configuration with F5 (or Debug | Start Debugging). The window configuration should change slightly and a panel on the left-hand side of the window shows local variables (among other things):
  1. Using the small control panel on top, you can then control the execution flow and watch the stack and memory on the left change accordingly. Note also the difference between an array and a (heap-allocated) vector!

Now, let's go behind the scenes to understand the code better.

How it works...

Rust is built on the LLVM compiler toolkit that comes with a range of features out of the box. When a Rust program compiles, it only gets translated into an intermediate language, from which the LLVM compiler creates native bytecode.

This is also the reason why debugging can work in this case—it builds on the LLVM debug symbols. While it clearly lacks the convenience of modern IDEs, it's a large step forward and allows users to inspect types. Future development of the tools will hopefully improve this situation as well; for now, the general debugger, GDB (https://www.gnu.org/software/gdb/), handles most of the cases where debug symbols are compiled into the program. The configuration for connecting the debugger with the code in the IDE can be found in step 2 and, by setting the breakpoint in step 4, it can track the relationship between lines of code and output. With the default setting to compile to debug, the debugger can then stop at this exact point. While it's not perfect (on the UX side), its capabilities are amazing.

Even this simple connection to a (UX-wise) very basic debugger can have great benefits for developers and represents a huge step up from println!() statements to inspect the current value of a variable.

We hope that you can use the debugger's capabilities in the remainder of this book. With this knowledge, you can now move on to the next chapter.