Book Image

Mastering TypeScript 3 - Third Edition

By : Nathan Rozentals
Book Image

Mastering TypeScript 3 - Third Edition

By: Nathan Rozentals

Overview of this book

TypeScript is both a language and a set of tools to generate JavaScript. It was designed by Anders Hejlsberg at Microsoft to help developers write enterprise-scale JavaScript. Starting with an introduction to the TypeScript language, before moving on to basic concepts, each section builds on previous knowledge in an incremental and easy-to-understand way. Advanced and powerful language features are all covered, including asynchronous programming techniques, decorators, and generics. This book explores many modern JavaScript and TypeScript frameworks side by side in order for the reader to learn their respective strengths and weaknesses. It will also thoroughly explore unit and integration testing for each framework. Best-of-breed applications utilize well-known design patterns in order to be scalable, maintainable, and testable. This book explores some of these object-oriented techniques and patterns, and shows real-world implementations. By the end of the book, you will have built a comprehensive, end-to-end web application to show how TypeScript language features, design patterns, and industry best practices can be brought together in a real-world scenario.
Table of Contents (16 chapters)
Free Chapter
1
TypeScript Tools and Framework Options

TypeScript IDEs

The purpose of this section of the chapter is to get you up and running with a TypeScript environment so that you can edit, compile, run, and debug your TypeScript code. TypeScript has been released as an open source project, and includes both a Windows variant, as well as a Node variant. This means that the compiler will run on Windows, Linux, macOS, and any other operating system that supports Node. On Windows environments, we can either install Visual Studio, which will register tsc.exe (TypeScript compiler) in our c:\Program Files directory, or we can use Node. On Linux and macOS environments, we will need to use Node.

In this section, we will be looking at the following IDEs:

  • Node-based compilation
  • Visual Studio Code
  • Visual Studio 2017
  • WebStorm
  • Using Grunt

Node-based compilation

The simplest and leanest TypeScript development environment consists of a simple text editor, and a Node-based TypeScript compiler. Head over to the Node website (https://nodejs.org/) and follow the instructions to install Node on your operating system of choice.

Once Node is installed, TypeScript can be installed by simply typing the following:

npm install -g typescript

This command invokes the Node Package Manager (npm) to install TypeScript as a global module (the -g option), which will make it available no matter what directory we are currently in. Once TypeScript has been installed, we can display the current version of the compiler by typing the following:

tsc -v

At the time of writing, the TypeScript compiler is at version 3.3.3, and therefore the output of this command is as follows:

Version 3.3.3

Let's now create a TypeScript file named hello.ts with the following content:

console.log('hello TypeScript'); 

From the command line, we can use TypeScript to compile this file into a JavaScript file by issuing the following command:

tsc hello.ts 

Once the TypeScript compiler has completed, it will have generated a hello.js file in the current directory. We can run this file using Node by typing the following:

node hello.js

This will output the following to the console:

hello TypeScript

Creating a tsconfig.json file

The TypeScript compiler uses a tsconfig.json file at the root of the project directory to specify any global TypeScript project settings and compiler options. This means that instead of compiling our TypeScript files one by one (by specifying each file on the command line), we can simply type tsc from the project root directory, and TypeScript will recursively find and compile all TypeScript files within the root directory and all sub-directories. The tsconfig.json file that TypeScript needs in order to do this can be created from the command line by simply typing the following:

tsc --init

The result of this command is a basic tsconfig.json file as follows:

{
    "compilerOptions": {
        "target": "es5",
        "module": "commonjs",
        "strict": true,
        "esModuleInterop": true
    }
}

This is a simple JSON format file, with a single JSON property named compilerOptions, which specifies compile options for the project. The target property indicates the preferred JavaScript output to generate, and can be either es3, es5, es6, ES2016, ES2017, or ESNext. The option named strict is a flag to turn on all strict type-checking options. We will explore the meaning of these options in Chapter 5, Declaration Files and Strict Compilation Options. The esModuleInterop option has to do with the generation of modules, which we will also discuss in Chapter 10, Modularization.

TypeScript allows for multiple tsconfig.json files within a directory structure. This allows different sub directories to use different compiler options.

With our tsconfig.json file in place, we can compile our application by simply typing the following:

tsc

This command will invoke the TypeScript compiler, using the tsconfig.json file that we have created, and generate a hello.js JavaScript file. In fact, any TypeScript source file that has a file extension of .ts will generate a JavaScript file with an extension of .js.

We have successfully created a simple Node-based TypeScript development environment, with a simple text editor and access to the command line.

Localized messages

When invoking the TypeScript compiler through the command line, we can also specify that any messages should be displayed in a specific language. This is accomplished via the --locale command-line option, as follows:

tsc --locale pl

Here, we are compiling our source code as per usual, but the message output will be in Polish, as follows:

error TS2322: Typu „number” nie można przypisać do typu „string”

As at the time of writing, the possible values that can be used for the --locale compile option are as follows:

    en English US
    cs Czech
    de German
    es Spanish
    fr French
    it Italian
    ja Japanese
    ko Korean
    pl Polish
    ru Russian
    tr Turkish
  
There is no corresponding tsconfig.json option for the --locale command-line option, so this will need to be included whenever running tsc from the command line.

When building TypeScript applications, all of the frameworks and supporting tools you will need come with a command-line interface. It is not unusual to see a developer running multiple command-line windows, one for automatic code compilation, one for running a web server, and another to run unit tests, as and when the code base changes. If you are developing on Windows, then take a look at the excellent command-line emulator named cmder (http://cmder.net/). It supports multiple tabs, split screens, and includes a Linux emulator with out-of-the-box git support.

If you are looking for a good TypeScript source code editor, then you simply must consider Visual Studio Code (VSCode). Using a Node-based command-line environment and VSCode is all you will need to build any TypeScript project on any operating system. If you are familiar with Microsoft Visual Studio, or Webstorm, and like a fully integrated development environment, then these two IDEs may be best suited.

Visual Studio Code

Visual Studio Code (VSCode) is a lightweight development environment produced by Microsoft that runs on Windows, Linux, and macOS. It includes development features such as syntax highlighting, bracket matching, Intellisense, and also has support for many different languages. These languages include TypeScript, JavaScript, JSON, HTML, CSS, C#, C++, Java, and many more, making it ideal for TypeScript development targeting either web pages or Node. Its main focus is Node development with TypeScript, and ASP.NET Core development with C#. It also has strong Git support out of the box, and was even built using TypeScript and Electron.

Installing VSCode

VSCode can be installed on Windows by simply downloading and running the installer. On Linux systems, VSCode is provided as either a .deb package, an .rpm package, or a binary tar file. In macOS, download the .zip file, unzip it, and then copy the Visual Studio Code.app file to your applications folder.

Exploring VSCode

Create a new directory to hold your source code, and fire up VSCode. This can be done by navigating to the directory, and executing code . from the command line. On Windows systems, fire up VSCode, and then Select File | Open folder from the menu bar. Hit Ctrl+N to create a new file, and type the following:

console.log("hello vscode"); 

Note that there is no syntax highlighting at this stage, as VSCode does not know what type of file it is working with. Hit Ctrl+S to save the file, and name it hello.ts. Now that VSCode understands that this is a TypeScript file, you will have full Intellisense and syntax highlighting available.

Creating a tasks.json file

VSCode uses a special tasks.json file in order to run commonly used tasks that you may need in your development life cycle. Obviously, one of the most common tasks you will need to run is the compilation step, otherwise known as the build step. The keyboard shortcut to build a project in VSCode is Ctrl+Shift+B.

In order to run a build step with Ctrl+Shift+B, we will need to create a tasks.json file, and configure it correctly to run the tsc command to build our project. If you do not already have a tsconfig.json file for your project, then go ahead and create one from the command line by typing the following:

tsc --init

Once we have a tsconfig.json file for our project, we can configure the default build task. In VSCode, hit Ctrl+Shift+B. This will bring up an option to select a build task to run. Select the tsc : build - tsconfig.json option. This will execute the tsc compilation step for your project, and show the results in the built-in terminal.

Unfortunately, if we hit Ctrl+Shift+B again, we will be prompted to select a build task once more. This means that, although we have configured a build task, we have not specified what task should be run by default when we hit the build shortcut. There are two ways that we can specify this default build task. The first is by selecting the menu option Tasks | Configure Default build task. This will bring up an option where we can select the tsc : build - tsconfig.json task as our default. Choosing this option will open the tasks.json file in the .vscode directory in the editor.

The second way to specify the default build task is through the command pallet. VSCode has many commands that can be configured through the command pallet, and each one can be tied to a specific shortcut key. Selecting the menu option View | Command Pallet, or the shortcut key Ctrl+Shift+P, will bring up a list of available commands. This list can be filtered by simply typing a keyword. If we start typing the word task, the list is automatically filtered to only show commands that contain the word "task". We can then select the Tasks : configure default build task to open the tasks.json file in the editor.

Note that there are many available commands that can be selected via the View | Command Pallet menu option, or by hitting the shortcut key, Ctrl+Shift+P. Take a few minutes to scroll through the list of commands to see how configurable VSCode actually is.

Whether we have navigated to the configure default build tasks via the menu option, or from the command pallet, VSCode will open our tasks.json file in the editor, as follows:

{ 
    // See https://go.microsoft.com/fwlink/?LinkId=733558 
    // for the documentation about the tasks.json format 
    "version": "2.0.0", 
    "tasks": [ 
        { 
            "type": "typescript", 
            "tsconfig": "tsconfig.json", 
            "problemMatcher": [ 
                "$tsc" 
            ], 
            "group": { 
                "kind": "build", 
                "isDefault": true 
            } 
        } 
    ] 
} 

This tasks.json file has a version property and a tasks property. The tasks property is an array of tasks that have a number of sub-properties. VSCode has automatically created a task for us that will compile our project, and specified via the group.isDefault property that this is the default build task.

Note that ,when editing this file, VSCode will automatically show us what properties are available depending on which part of the file we are modifying, as follows:

Here, we can see that VSCode is showing us that the available configuration properties for a task include identifier, isBackground, label, and others.

A handy property to keep in mind is the label property, which we can use to specify an easy-to-remember name for our task. Let's add this label property, and set its value to Run tsc build. Now, whenever we see this build task in a list of options, it will be displayed as Run tsc build, which helps us to remember which task is which.

Building the project

Our sample project can now be built by hitting Ctrl+Shift+B. Note that, in the base directory of our project, we now have a hello.js and a hello.js.map file as the result of the compilation step.

Creating a launch.json file

VSCode includes an integrated debugger that can be used to debug TypeScript projects. If we switch to the Debugger panel, or simply hit F5 to start debugging, VSCode will ask us to select a debugging environment. For the time being, select the Node.js option, which will create a launch.json file in the .vscode directory, and again open it for editing. Find the option named program, and modify it to read "${workspaceFolder}/hello.js". Hit F5 again, and VSCode will launch hello.js as a Node program and output the results to the debugging window:

node --debug-brk=34146 --nolazy hello.js 
debugger listening on port 34146
hello vscode  

Setting breakpoints

Using breakpoints and debugging at this stage will only work on the generated .js JavaScript files. We will need to make a change to the tsconfig.json file to enable debugging directly in our TypeScript files. Edit the tsconfig.json file, and add a property with the name sourceMaps and the property value true. This instructs the compiler to output a source map file (named .map) for each TypeScript file we are compiling. Once we rebuild the project, these map files will appear in our source code tree. Now, we can set breakpoints directly in our .ts files for use by the VSCode debugger:

Debugging web pages

Debugging TypeScript, which is running within a web page in VSCode, requires a little more setup. VSCode uses the Chrome debugger to attach to a running web page. To enable debugging web pages, we will firstly need to add a Debug configuration to our launch.json file. Luckily, VSCode has a toolbar command for this, and will generate a launch configuration for us. Select the Debug | Add Configuration menu option, and then select the Chrome Attach option. This will modify our launch.json file as follows:

"configurations": [ 
    { 
        "type": "chrome", 
        "request": "attach", 
        "name": "Attach to Chrome", 
        "port": 9222, 
        "webRoot": "${workspaceFolder}" 
    }, 
    { 
        "type": "node", 
... } ]

This launch option is named Attach to Chrome, and will attach to a running instance of Chrome using the debug port 9222. Save the launch.json file, and create an HTML page named index.html at the root directory of the project, as follows:

<html> 
    <head> 
    <script src="helloweb.js"></script> 
    </head> 
    <body> 
        hello vscode 
        <div id="content"></div> 
    </body> 
</html> 

This is a very simple page that loads the helloweb.js file, and displays the text, hello vscode. Our helloweb.ts file is as follows:

window.onload = () => { 
    console.log("hello vscode"); 
}; 

This TypeScript code simply waits for the web page to load, and then logs hello vscode to the console.

The next step is to fire up Chrome using the debug port option. On Linux systems, this is done from the command prompt, as follows:

google-chrome --remote-debugging-port=9222 

Note that you will need to ensure that there are no other instances of Chrome running in order to use it as a debugger with VSCode.

Next, load the index.html file in the browser by using Ctrl+O, and selecting the file to load. You should see the HTML file rendering the hello vscode text.

Now, we can go back to VSCode, click on the debugging icon, and select the Attach Chrome option in the launcher dropdown. Hit F5, and the VSCode debugger should now be attached to the running instance of Chrome. We will then need to refresh the page in Chrome in order to start debugging:

With a slight tweak to our launch.json, we can combine these manual steps into a single launcher, as follows:

{ 
    "name": "Launch chrome", 
    "type": "chrome", 
    "request" : "launch", 
    "url" : "file:/// ... insert full path here ... /index.html", 
    "runtimeArgs": [ 
        "--new-window", 
        "--remote-debugging-port=9222" 
    ], 
    "sourceMaps": true 
} 

In this launch configuration, we have changed the request property from attach to launch, which will launch a new instance of Chrome, and automatically navigate to the file path specified in the url property. The runtimeArgs property also now specifies the remote debugging port of 9222. With this launcher in place, we can simply hit F5 to launch Chrome, with the correct URL and debugging options for the debugging of HTML applications.

Microsoft Visual Studio

Let's now look at Microsoft Visual Studio. This is Microsoft's primary IDE, and comes in a variety of pricing combinations. At the time of writing, Microsoft's latest version is Visual Studio 2017. Microsoft has an Azure-based licensing model, starting at around $45 per month, all the way up to a professional license with an MSDN subscription at around $1,199. The good news is that Microsoft also has a Community edition, which can be used in non-enterprise environments for both free and non-paid products. The TypeScript compiler is included in all of these editions.

Visual Studio can be downloaded as either a web installer or an .iso CD image. Note that the web installer will require an internet connection during installation, as it downloads the required packages during the installation step. Visual Studio will also require Internet Explorer 10 or later, but will prompt you during installation if you have not upgraded as yet. If you are using the .iso installer, just bear in mind that you may be required to download and install additional operating system patches if you have not updated your system in a while.

Creating a Visual Studio project

Once Visual Studio 2017 is installed, fire it up and create a new project (File | New Project). There are many different options available for new project templates, depending on your choice of language. Under the Templates section on the left-hand side, you will see an Other Languages option, and under this, a TypeScript option. The project templates that are available are slightly different in Visual Studio 2017 than they were in Visual Studio 2015, and are geared toward Node development. Visual Studio 2015 included a template named Html Application with TypeScript, which will create a very simple, single-page web application for you. Unfortunately, this option has been removed in Visual Studio 2017:

To create a simple TypeScript web application in Visual Studio 2017, we will need to create a blank web application first, and then we can add TypeScript files to this project as required. From our Templates dialog, select the Visual C# template option, and then select the Web option. This will give us a project template named ASP.NET Web Application. Select a Name and a Location for the new project, and then click on Ok, as demonstrated in the following screenshot:

Once we have selected the basic information for our new project, Visual Studio will generate a second dialog box asking what sort of ASP.NET project we would like to generate. Select the Empty template, and click on Ok:

Visual Studio 2017 will then pop up another dialog named Create App Service, which provides options for creating a host in Azure for your new web application. We will not be publishing our application to Azure, so we can click on Skip at this stage.

Default project settings

Once a new Empty ASP.NET web application has been created, we can start adding files to the project by right-clicking on the project itself, and selecting Add then New Item. There are two files that we are going to add to the project, namely, an index.html file, and an app.ts TypeScript file. For each of these files, select the corresponding Visual Studio template, as follows:

We can now open up the app.ts file and start typing the following code:

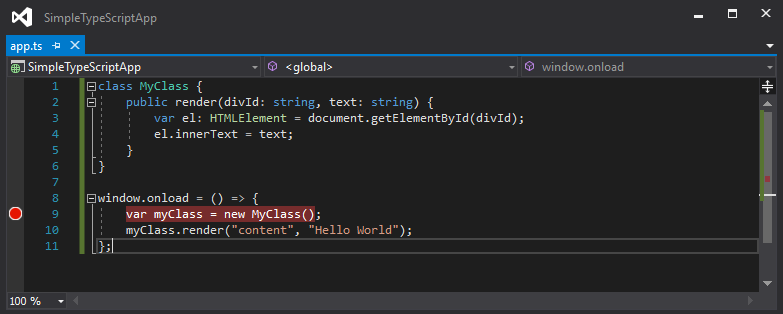
class MyClass { 
    public render(divId: string, text: string) { 
        var el: HTMLElement = document.getElementById(divId); 
        el.innerText = text; 
    } 
} 
 
window.onload = () => { 
    var myClass = new MyClass(); 
    myClass.render("content", "Hello World"); 
}; 

Here, we have created a class named MyClass, that has a single render function. This function takes two parameters, named divId and text. The function finds an HTML DOM element that matches the divId argument, and then sets the innerText property to the value of the text argument. We then define a function to be called when the browser calls window.onload. This function creates a new instance of the MyClass class, and calls the render function.

Do not be alarmed if this syntax and code is a little confusing. We will be covering all of the language elements and syntax in later chapters. The point of this exercise is simply to use Visual Studio as a development environment for editing TypeScript code.

You will notice that Visual Studio has very powerful Intellisense options, and will suggest code, function names, or variable names as and when you are typing your code. If they are not automatically appearing, then hitting Ctrl+spacebar will bring up the Intellisense options for the code you are currently typing.

With our app.ts file in place, we can compile it by hitting Ctrl+Shift+B, or F6, or by selecting the Build option from the toolbar. If there are any errors in the TypesScript code that we are compiling, Visual Studio will automatically pop up an Error List panel, showing current compilation errors. Double-clicking on any one of these errors will bring up the file in the editor panel, and automatically move the cursor to the offending code.

The generated app.js file is not included in the Solution Explorer in Visual Studio. Only the app.ts TypeScript file is included. This is by design. If you wish to see the generated JavaScript file, simply click on the Show All Files button in the Solution Explorer toolbar.

To include our TypeScript file in the HTML page, we will need to edit the index.html file, and add a <script> tag to load app.js, as follows:

<!DOCTYPE html> 
<html> 
<head> 
    <meta charset="utf-8" /> 
    <title></title> 
     <script src="app.js"></script> 
</head> 
<body> 
    <div id="content"></div> 
</body> 
</html> 

Here, we have added the <script> tag to load our app.js file, and have also created a <div> element with the id of content. This is the DOM element that our code will modify the innerHtml property of. We can now hit F5 to run our application:

Debugging in Visual Studio

One of the best features of Visual Studio is that it is truly an integrated environment. Debugging TypeScript in Visual Studio is exactly the same as debugging C# or any other language in Visual Studio, and includes the usual Immediate, Locals, Watch, and Call stack windows.

To debug TypeScript in Visual Studio, simply put a breakpoint on the line you wish to break on in your TypeScript file (move your mouse into the breakpoint area next to the source code line, and click). In the following screenshot, we have placed a breakpoint within the window.onload function. To start debugging, simply hit F5:

When the source code line is highlighted in yellow, simply hover your mouse over any of the variables in your source, or use the Immediate, Watch, Locals, or Call stack windows.

Note that Visual Studio only supports debugging in Internet Explorer 11. If you have multiple browsers installed on your machine (including Microsoft Edge), make sure that you select Internet Explorer in your Debug toolbar, as shown in the following screenshot:

WebStorm

WebStorm is a popular IDE by JetBrains (http://www.jetbrains.com/webstorm/), and will run on Windows, macOS, and Linux. Prices range from $59 per year for a single developer to $129 per year for a commercial license. JetBrains also offers a 30-day trial version.

WebStorm has a couple of great features, including live edit, code refactoring suggestions, and Intellisense. Live edit, in particular, allows you to keep a browser open that will automatically update based on changes to CSS, HTML, and JavaScript as you type it. Code suggestions, which are also available with another popular JetBrains product, ReSharper, will highlight code that you have written and suggest better ways of implementing it. WebStorm also has a large number of project templates, which are seamlessly integrated into the IDE, automatically downloading and including the relevant JavaScript or CSS files in your project.

On Windows systems, setting up WebStorm is as simple as downloading the package from the website, and running the installer. On Linux systems, Webstorm is provided as a tar ball. Once unpacked, install WebStorm by running the webstorm.sh script in the bin directory. Note that on Linux systems, a running version of Java must be installed before setup will continue.

Creating a WebStorm project

To create a WebStorm project, fire up WebStorm, and hit File | New Project. Select a template from the left-hand menu, and fill in the configuration options in the right-hand panel. Depending on which template is chosen for the project, the configuration options will change. For this project, we will select the Twitter Bootstrap template, which only requires a location and a bootstrap version:

Default files

Once a project template has been selected, WebStorm will create a default project directory tree, and download the required files in order for us to start using this template. For a Bootstrap project, note that Webstorm has conveniently created a css and js directory, and downloaded and included the relevant CSS and JavaScript files automatically. Note that the project template has not created an index.html file for us, nor has it created any TypeScript files. So let's create an index.html file.

Simply click on File | New and select HTML file, enter index as a name, and click OK.

Next, let's create a TypeScript file in a similar manner. Select File | New, and then TypeScript file. We will call this file app (or app.ts), in order to mirror the Visual Studio project that we created earlier. As we click inside the new app.ts file, WebStorm will pop up a message at the top of the file, with a suggestion reading Compile TypeScript to JavaScript?, with three options – OK, No, and Configure, as shown in the following screenshot:

Clicking on Configure will bring up the Settings panel for TypeScript. There are a number of options on this panel, but, for the time being, we can simply accept the defaults, and click Ok.

Building a simple HTML application

Now that we have configured WebStorm to compile our Typescript files, let's create a simple TypeScript class and use it to modify the innerText property of an HTML div. While you are typing, you will notice WebStorm's autocompletion or Intellisense feature helping you with available keywords, parameters, and naming conventions, among others. This is one of the most powerful features of WebStorm, and is similar to the enhanced Intellisense seen in Visual Studio. To see a list of TypeScript compilation errors, we can open the TypeScript output window by navigating to View | Tool Windows | TypeScript. As we type code into this file, WebStorm will automatically compile our file ( without needing to save it), and report any errors in the TypeScript tool window. Go ahead and type the following TypeScript code, during which you will get a good feeling of WebStorm's available autocompletion, and the error-reporting capabilities:

class MyClass { 
    public render(divId: string, text: string) { 
        var el: HTMLElement | null = document.getElementById(divId); 
        if (el) { 
            el.innerText = text; 
        } 
    } 
} 
 
window.onload = () => { 
    var myClass = new MyClass(); 
    myClass.render("content", "Hello World"); 
} 

This code is similar to the sample we used for Visual Studio 2017.

If you have any errors in your TypeScript file, these will automatically show up in the output window, giving you instant feedback while you type.

With this TypeScript file created, we can now include it in our index.html file and try some debugging.

Open the index.html file, and add a script tag to include the app.js JavaScript file, along with a div with an id of content. Just as we saw with TypeScript editing, you will find that WebStorm has powerful Intellisense features when editing HTML as well:

<!DOCTYPE html> 
<html> 
<head lang="en"> 
    <meta charset="UTF-8"> 
    <title></title> 
    <script src="app.js"></script> 
</head> 
<body> 
    <div id="content"></div> 
</body> 
</html> 

Again, this HTML is the same as we used earlier in the Visual Studio example.

Running the web page in Chrome

When viewing or editing HTML files in WebStorm, you will notice a small set of browser icons popping up in the top-right corner of the editing window. Clicking on any one of the icons will launch your current HTML page using the selected browser:

To debug our web application in WebStorm, we will need to set up a debug configuration for the index.html file. Click on Run | Debug, and then edit configurations. Click on the plus (+) button, select the JavaScript debug option on the left, and give this configuration a name. Note that WebStorm has already identified that index.html is the default page, but this can easily be modified. Next, click on Debug at the bottom of the screen, as shown in the following screenshot:

WebStorm uses a Chrome plugin to enable debugging in Chrome and will prompt you the first time you start debugging to download and enable the JetBrains IDE Support Chrome plugin. With this plugin enabled, WebStorm has a very powerful set of tools to inspect JavaScript code, add watchers, view the console, and many more, right inside the IDE, as demonstrated in the following screenshot:

Other editors

There are a number of editors that include support for TypeScript, such as Atom, Brackets, and even the age-old Vim editor. Each of these editors have varying levels of TypeScript support, including syntax highlighting and Intellisense. Using these editors represents a bare-bones TypeScript development environment, relying on the command line to automate build tasks. They do not have built-in debugging tools, and therefore do not qualify as an Integrated Development Environment (IDE) per se, but can easily be used to build TypeScript applications. The basic workflow using these editors would be as follows:

  1. Create and modify files using the editor
  2. Invoke the TypeScript compiler from the command line
  3. Run or debug applications using existing debuggers

Using --watch and Grunt

In a bare-bones environment, any change to a TypeScript file means that we need to reissue the tsc command from the command line every time we wish to compile our project. Obviously, it is going to be very tedious to have to switch to the command prompt and manually compile our project every time we have made a change. Fortunately, the TypeScript compiler provides the --watch option that will run a background task to monitor files for changes, and automatically recompile them when a change is detected. From the command line, we can run the following:

tsc --watch

Here, we have invoked the TypeScript compiler with the --watch option, which will then start the compilation step in watch mode. As and when we modify .ts files in our project directory, the compilation step will re-execute, and report any errors found.

If we have a more complicated build process that compiles our project, for example, and then needs to uglify the resulting JavaScript, we can use an automated task runner such as Grunt or Gulp. As an example of this process, let's replicate the --watch option by using Grunt to automatically invoke the tsc compiler when a file is saved. Gulp is a very similar task runner to Grunt, and, in certain circumstances, can perform steps faster than Grunt. Grunt, however, has a simpler syntax for configuration, and so we will use it in this section to introduce the concept of automated task runners.

Grunt runs in a Node environment, and therefore needs to be installed as an npm dependency of our project. To install Grunt, we will first need to create a packages.json file in the base directory of the project that will list all of the npm package dependencies that we may need. To create this packages.json file, open up a command prompt, navigate to the base directory of your project, and then simply type the following:

npm init

Then follow the prompts. You can pretty much leave all of the options as their defaults, and always go back to edit the packages.json file that is created from this step, should you need to tweak any changes.

Now that we have a packages.json file created, we can install Grunt. Grunt has two components that need to be installed independently. Firstly, we need to install the Grunt command-line interface that allows us to run Grunt from the command line. This can be accomplished as follows:

npm install -g grunt-cli  

The second component is to install the Grunt files within our project directory:

npm install grunt --save-dev

The --save-dev option will install a local version of Grunt in the project directory. This is done so that multiple projects on your machine can use different versions of Grunt. We will also need the grunt-exec package, as well as the grunt-contrib-watch package installed for the project. These can be installed with the following commands:

npm install grunt-exec --save-dev
npm install grunt-contrib-watch --save-dev

Lastly, we will need a GruntFile.js. Using an editor, create a new file, save it as GruntFile.js, and enter the following JavaScript. Note that we are creating a JavaScript file here, not a TypeScript file. You can find a copy of this file in the sample source code that accompanies this chapter:

module.exports = function (grunt) { 
    grunt.loadNpmTasks('grunt-contrib-watch'); 
    grunt.loadNpmTasks('grunt-exec'); 
    grunt.initConfig( { 
        pkg: grunt.file.readJSON('package.json'), 
        watch : { 
            files : ['**/*.ts'], 
            tasks : ['exec:run_tsc'] 
        }, 
        exec: { 
            run_tsc: { cmd : 'tsc'} 
        } 
    }); 
    grunt.registerTask('default', ['watch']); 
}; 

This GruntFile.js contains a simple function to initialize the Grunt environment, and specify the commands to run. The first two lines of the function are loading grunt-contrib-watch and grunt-exec as npm tasks. We then call initConfig to configure the tasks to run. This configuration section has a pkg property, a watch property, and an exec property. The pkg property is used to load the package.json file that we created earlier as part of the npm init step.

The watch property has two sub-properties. The files property specifies a matching algorithm for Grunt to identify which files to watch for. In this case, it is set to find any .ts files within our entire source tree. The tasks array specifies that we should kick off the exec:run_tsc command once a file has changed. Finally, we call grunt.registerTask, specifying that the default task is to watch for file changes.

We can now run grunt from the command line, as follows:

grunt

As can be seen from the command line output, Grunt is running the watch task, and is waiting for changes to any .ts files, as follows:

Running "watch" task
Waiting...

Open up any TypeScript file, make a small change (add a space or something), and then hit Ctrl+S to save the file. Now, check back on the output from the Grunt command line. You should see something like the following:

>> File "hellogrunt.ts" changed.
Running "exec:run_tsc" (exec) task
    
Done, without errors.
Completed in 1.866s at Fri Jul 20 2018 22:22:52 GMT+0800 (AWST) - Waiting...
  

This command line output is confirmation that the Grunt watch task has identified that the hellogrunt.ts file has changed, run the exec:run_tsc task, and is waiting for the next file to change. We should now also see a hellogrunt.js file in the same directory as our Typescript file.