Book Image

R Programming Fundamentals

By : Kaelen Medeiros
Book Image

R Programming Fundamentals

By: Kaelen Medeiros

Overview of this book

R Programming Fundamentals, focused on R and the R ecosystem, introduces you to the tools for working with data. You’ll start by understanding how to set up R and RStudio, followed by exploring R packages, functions, data structures, control flow, and loops. Once you have grasped the basics, you’ll move on to studying data visualization and graphics. You’ll learn how to build statistical and advanced plots using the powerful ggplot2 library. In addition to this, you’ll discover data management concepts such as factoring, pivoting, aggregating, merging, and dealing with missing values. By the end of this book, you’ll have completed an entire data science project of your own for your portfolio or blog.
Table of Contents (6 chapters)

Getting Help with R

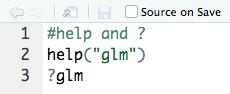
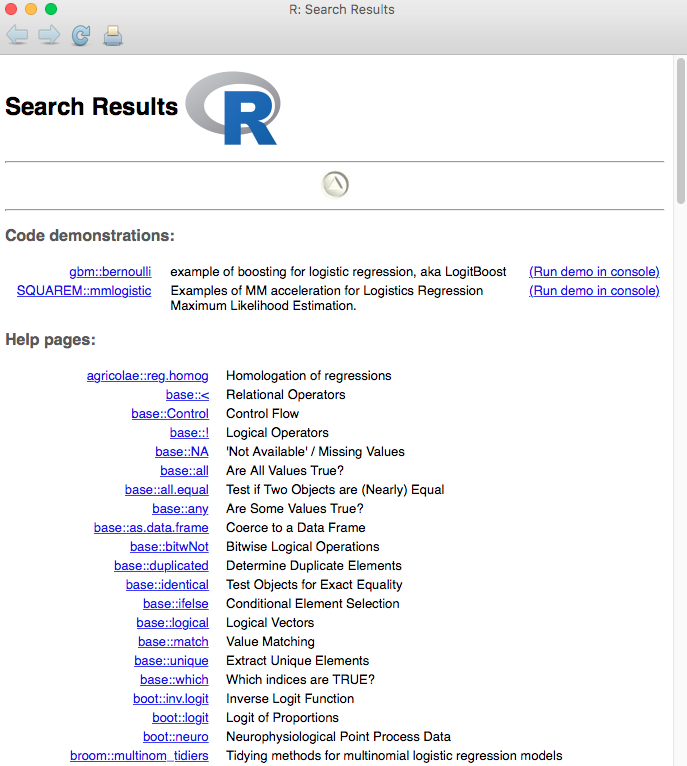
We've covered a lot in this chapter, and this is the last thing that you'll carry throughout this book and into the rest of the time you spend learning R: how do you get help with R programming and data science?

Package Documentation and Vignettes

One advantage of using R is that it is a very well-documented programming language. This is often because there is a certain amount of documentation that is required by CRAN before it will publish a package on the website.

It is considered a best practice to document your packages or functions well, no matter where you are publishing them. Good documentation is important, both for other people who may use your functions and also for yourself when you return to them in the future.

As such, there are a few built-in ways in R to get help. The first way to get help is to use the package documentation. You can access it by using the help() function or the question mark ?. These will do the same thing. For example, say you (this one happens a lot) can't remember off the top of your head the inputs to the glm() function. The following code will bring up the documentation for the glm() function, as shown in the following screenshot:

If you read the documentation, you will see that you need to input at least a formula, family, and dataset name.

Of course, help() and the question mark ? can only help you with packages and functions you already know the name of. When you're not as sure, you can use help. search() and ?? to find things. These functions are also analogous, and will search the built-in help documentation for any and all instances of what you're looking for, for example, help.search("logit") or ??logit.

Both of the preceding options return a long list of help pages where logit appears. As you look through the results of your search for logit in the R documentation, you may notice that there are lots of things written in the format agricolae::reg.homog and base::Control.

In R, this notation means that the agricolae package has a function called reg.homog (agricolae::reg.homog), and that the base package has a function called Control (base::Control).

The double colon :: always separates a package and function name in R. (This comes in handy when you have functions named after the same thing in multiple packages, such as stats::filter and dplyr::filter!)

In addition to the often very helpful and thorough documentation built into R, some packages also have one or more vignettes, which are documents written by the author(s) of the package that are intended to demonstrate the main functionality of the functions contained in the package. You can bring these up inside RStudio in a number of ways.

Let's use the vignette-related functions browseVignettes() and vignettes() to explore the vignettes for R packages. Follow the steps given below:

  1. To see a list of many available vignettes in R, use the browseVignettes() method:
    • Browse the vignettes available for the dplyr package using the method syntax browseVignettes(package = "dplyr") or browseVignettes("dplyr")
  2. Access the vignette for the tibble package using the syntax vignette("tibble") or vignette(package = "tibble").
  3. In a search engine of your choice, find the vignette for the R package tidyr.

Check your Help tab to see the vignettes when you access them inside of RStudio. The output will be as follows:

Activity: Exploring the Introduction to dplyr Vignette

Scenario

You have been asked to write code by utilizing the main verb functions (filter, arrange, select, mutate, and summarise) that are available in the dplyr package.

Aim

To gain experience of looking for vignettes and to also introduce the dplyr package.

Prerequisites

A web browser capable of looking at an R package vignette.

Steps for Completion

  1. Navigate, in your web browser, to the introduction to the dplyr vignette (https://cran.r-project.org/web/packages/dplyr/vignettes/dplyr.html). dplyr is a package that is part of the Tidyverse we installed way back in the first section. You can also access the vignette inside of RStudio by running vignette("dplyr") in a script or by typing it in the console. It will appear in the Help tab in the lower right window.
  2. Open up a new R Script (File | New File | R Script). Save it as a file called dplyr_vignette_walkthrough.R.
  3. Read the dplyr vignette, running at least the first line of code for each of the main five dplyr verbs (filter, arrange, select, mutate, and summarise). Make sure that your output mirrors that of the vignette.
  4. Stop when you reach the heading Patterns of operations, about halfway down the page. (It is recommended that you return later and read the entire vignette, as the dplyr package is very useful.)
  5. If you have time, play with the dplyr code a bit and try to understand more about how the main five verbs work through experimentation.

RStudio Community, Stack Overflow, and the Rest of the Web

Two of the main community-based resources online are the official RStudio Community and Stack Overflow.

Stack Overflow (SO) https://stackoverflow.com/ is a fantastic resource for a variety of questions relating to technology, with no limit on the different kinds of programming languages or analysis types you can ask questions about—the sky's the limit! There is an r tag (https://stackoverflow.com/questions/tagged/r) that has, as of late March 2018, 230,000+ tagged questions in it. Often, the best way to find what you're looking for is to go to a search engine, type something along the lines of how to relevel a factor in r, and often a SO post (or even multiple!) will be the top hits.

The RStudio Community (https://community.rstudio.com/) website is a forum that's run by RStudio themselves. It is expected that questions will be R-focused. They are often answered by the very people who wrote the packages and functions you are asking questions about. Questions are tagged by category, such as RMarkdown, General, and tidyverse, to help you navigate. The forum is searchable and filterable, and is a great place to get answers to any R-related questions.

More generally, #rstats on twitter (https://twitter.com/search?q=%23rstats&src=typd) is a great place to go for R questions, tips and tricks, and to find a community of people who are all over the R usage spectrum, from beginners to seasoned pros, who have often developed the packages used in R every day. Many R experts check the #rstats hashtag for questions, so it's another great way to get answers to R and data science queries. It's also a great way to find blog posts about R, which often include worked out examples that someone has solved, which are often useful as you are learning.

As learners new to R, you're sure to have many questions as you move on in your journey. Hopefully, you now know about and are even beginning to get comfortable with the many places both built into R and on the internet that you can go to for help, and eventually even help others as you gain confidence and skills.