Now, let's look at the most commonly used monitoring terminology in both literature and tools. The difference between some of these terms is subtle and you may have to pay close attention to understand them.
Host
A host used to mean a physical server during the data center era. In the monitoring world, it usually refers to a device with an IP address. That covers a wide variety of equipment and resources – bare-metal machines, network gear, IoT devices, virtual machines, and even containers.
Some of the first-generation monitoring tools, such as Nagios and Zenoss are built around the concept of a host, meaning everything that can be done on those platforms must be tied to a host. Such restrictions are relaxed in new-generation monitoring tools such as Datadog.
Agent
An agent is a service that runs alongside the application software system to help with monitoring. It runs various tasks for the monitoring tools and reports information back to the monitoring backend.
The agents are installed on the hosts where the application system runs. It could be a simple process running directly on the operating system or a microservice. Datadog supports both options and when the application software is deployed as microservices, the agent is also deployed as a microservice.
Metrics
Metrics in monitoring refers to a time-bound measurement of some information that would provide insight into the workings of the system being monitored. These are some familiar examples:
- Disk space available on the root partition of a machine
- Free memory on a machine
- Days left until the expiration of an SSL certificate
The important thing to note here is that a metric is time-bound and its value will change. For that reason, the total disk space on the root partition is not considered a metric.
A metric is measured periodically to generate time-series data. We will see that this time-series data can be used in various ways – to plot charts on dashboards, to analyze trends, and to set up monitors.
A wide variety of metrics, especially those related to infrastructure, are generated by monitoring tools. There are options to generate your own custom metrics too:
- Monitoring tools provide options to run scripts to generate metrics.
- Applications can publish metrics to the monitoring tool.
- Either the monitoring tool or others might provide plugins to generate metrics specific to third-party tools used by the software system. For example, Datadog provides such integrations for most of the popular tools, such as NGINX. So, if you are using NGINX in your application stack by enabling the integration, you can get NGINX-specific metrics.
Up/down status
A metric measurement can have a range of values, but up or down is a binary status. These are a few examples:
- A process is up or down
- A website is up or down
- A host is pingable or not
Tracking the up/down status of various components of a software system is core to all monitoring tools and they have built-in features to check on a variety of resources.
Check
A check is used by the monitoring system to collect the value of metrics. When it is done periodically, time-series data for that metric is generated.
While time-series data for standard infrastructure-level metrics is available out of the box in monitoring systems, custom checks could be implemented to generate custom metrics that would involve some scripting.
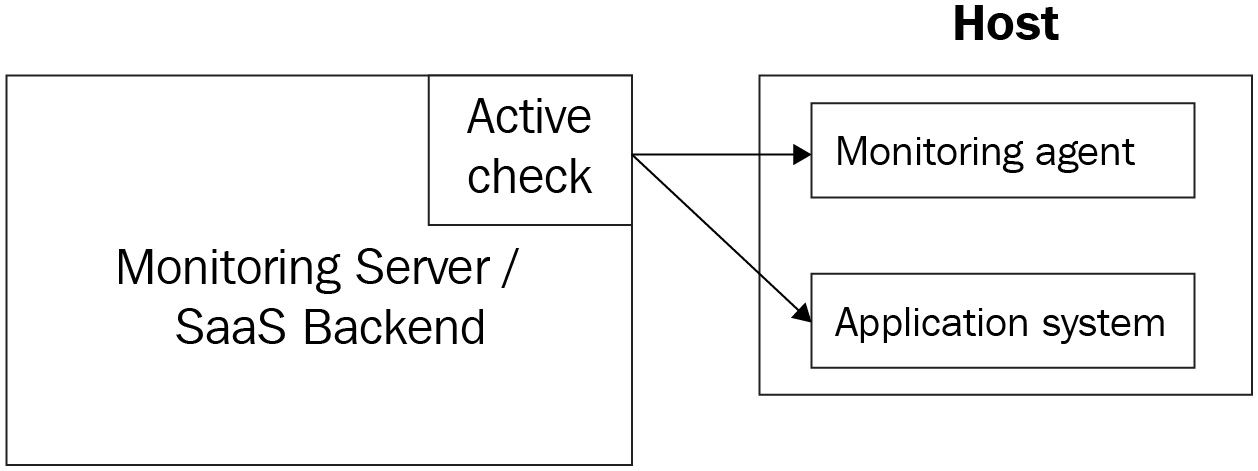
Figure 1.6 – Active check/pull model
A check can be active or passive. An active check is initiated by the monitoring backend to collect metrics values and up/down status info, with or without the help of its agents. This is also called the pull method of data collection.
Figure 1.7 – Passive check/push model
A passive check reports such data to the monitoring backend, typically with its own agents or some custom script. This is also called the push method of data collection.
The active/passive or pull/push model of data collection is standard across all monitoring systems. The method would depend on the type of metrics a monitoring system collects. You will see in later chapters that Datadog supports both methods.
Threshold
A threshold is a fixed value in the range of values possible for a metric. For example, on a root partition with a total disk space of 8 GB, the available disk space could be anything from 0 GB to 8 GB. A threshold in this specific case could be 1 GB, which could be set as an indication of low storage on the root partition.
There could be multiple thresholds defined too. In this specific example, 1 GB could be a warning threshold and 500 MB could be a critical or high-severity threshold.
Monitor
A monitor looks at the time-series data generated for a metric and alerts the alert recipients if the values cross the thresholds. A monitor can also be set up for the up/down status, in which case it alerts the alert recipients if the related resource is down.
Alert
An alert is produced by a monitor when the associated check determines that the metric value crosses a threshold set on the monitor. A monitor could be configured to notify the alert recipients of the alerts.
Alert recipient
The alert recipient is a user in the organization who signs up to receive alerts sent out by a monitor. An alert could be received by the recipient through one or more communication channels such, as E-Mail, SMS, and Slack.
Severity level
Alerts are classified by the seriousness of the issue that they unearth about the software system and that is set by the appropriate severity level. The response to an alert is tied to the severity level of the alert.
A sample set of severity levels could consist of the levels Informational, Warning, and Critical. For example, with our example of available disk space on the root partition, at 30% of available disk space, the monitor could be configured to alert as a warning and at 20% it could alert as critical.
As you can see, setting up severity levels for an increasing level of seriousness would provide the opportunity to catch issues and take mitigative actions ahead of time, which is the main objective of proactive monitoring. Note that this is possible in situations where a system component degenerates over a period of time.
A monitor that tracks an up/down status will not be able to provide any warning, and so a mitigative action would be to bring up the related service at the earliest. However, in a real-life scenario, there must be multiple monitors so at least one of them would be able to catch an underlying issue ahead of time. For example, having no disk space on the root partition can stop some services, and monitoring the available space on the root partition would help prevent those services from going down.
Notification
A message sent out as part of an alert specific to a communication platform such as email is called a notification. There is a subtle difference between an alert and a notification, but at times they are considered the same. An alert is a state within the monitoring system that can trigger multiple actions such as sending out notifications and updating monitoring dashboards with that status.
Traditionally, email distribution groups used to be the main communication method used to send out notifications. Currently, there are much more sophisticated options, such as chat and texting, available out of the box on most monitoring platforms. Also, escalation tools such as PagerDuty could be integrated with modern monitoring tools such as Datadog to route notifications based on severity.
Downtime
The downtime of a monitor is a time window during which alerting is disabled on that monitor. Usually, this is done for a temporary period while some change to the underlying infrastructure or software component is rolled out, during which time monitoring on that component is irrelevant. For example, a monitor that tracks the available space on a disk drive will be impacted while the maintenance task to increase the storage size is ongoing.
Monitoring platforms such as Datadog support this feature. The practical use of this feature is to avoid receiving notifications from the impacted monitors. By integrating a CI/CD pipeline with the monitoring application, the downtimes could be scheduled automatically as a prerequisite for deployments.
Event
An event published by a monitoring system usually provides details of a change that happened in the software system. Some examples are the following:
- The restart of a process
- The deployment or shutting down of a microservice due to a change in user traffic
- The addition of a new host to the infrastructure
- A user logging into a sensitive resource
Note that none of these events demand immediate action but are informational. That's how an event differs from an alert. A critical alert is actionable but there is no severity level attached to an event and so it is not actionable. Events are recorded in the monitoring system and they are valuable information when triaging an issue.
Incident
When a product feature is not available to users it is called an incident. An incident occurs when some outage happens in the infrastructure, this being hardware or software, but not always. It could also happen due to external network or internet-related access issues, though such issues are uncommon.
The process of handling incidents and mitigating them is an area by itself and not generally considered part of core monitoring. However, monitoring and incident management are intertwined for these reasons:
- Not having comprehensive monitoring would always cause incidents because, without that, there is no opportunity to mitigate an issue before it causes an outage.
- And of course, action items from a Root Cause Analysis (RCA) of an incident would have tasks to implement more monitors, a typical reactive strategy (or the lack thereof) that must be avoided.
On call
The critical alerts sent out by monitors are responded to by an on-call team. Though the actual requirements can vary based on the Service-Level Agreement (SLA) requirements of the application being monitored, on-call teams are usually available 24x7.
In a mature service engineering organization, three levels of support would be available, where an issue is escalated from L1 to L3:
- The L1 support team consists of product support staff who are knowledgeable about the applications and can respond to issues using runbooks.
- The L2 support team consists of Site Reliability Engineers (SREs) who might also rely on runbooks, but they are also capable of triaging and fixing the infrastructure and software components.
- The L3 support team would consist of the DevOps and software engineers who designed and built the infrastructure and software system in production. Usually, this team gets involved only to triage issues that are not known.
Runbook
A runbook provides steps to respond to an alert notification for on-call support personnel. The steps might not always provide a resolution to the reported issue and it could be as simple as escalating the issue to an engineering point of contact to investigate the issue.


 Free Chapter


