One of the main reasons for using C++ is efficiency. C++ gives us control over memory management, which is why understanding how objects are laid out in memory is important. Furthermore, C++ source files and libraries are compiled to object files for the target hardware and linked together. Often, C++ programmers have to deal with linker problems, which is why understanding the steps of the compilation and being able to investigate object files is important. On the other hand, large projects are developed and maintained by teams over a long period of time, which is why creating clean and understandable code is important. As with any other software, bugs arise in C++ projects and need to be identified, analyzed, and resolved carefully by observing the program behavior. Therefore, learning how to debug C++ code is also important. In the next section, we will learn how to create code that is efficient, plays well with other code, and is maintainable.
Compilation and Linking Steps
A C++ project is created as a set of source code files and project configuration files that organize the sources and library dependencies. In the compilation step, these sources are first converted to object files. In the linking step, these object files are linked together to form the executable that is the ultimate output of the project. The libraries that the project uses are also linked at this step.
In the upcoming exercises, we will use our existing project to observe the compilation and linking stages. Then, we will manually recreate them to view the process in more detail.
Exercise 7: Identifying Build Steps
You have been building your projects without investigating the details of the build actions. In this exercise, we will investigate the details of our project's build steps. Perform the following to complete the exercise:
- Open the terminal.
- Navigate to the
build folder wherein our Makefile file resides by typing the following command:cd build/Debug
- Clean the project and run the build in
VERBOSE mode using the following command:make clean
make VERBOSE=1 all
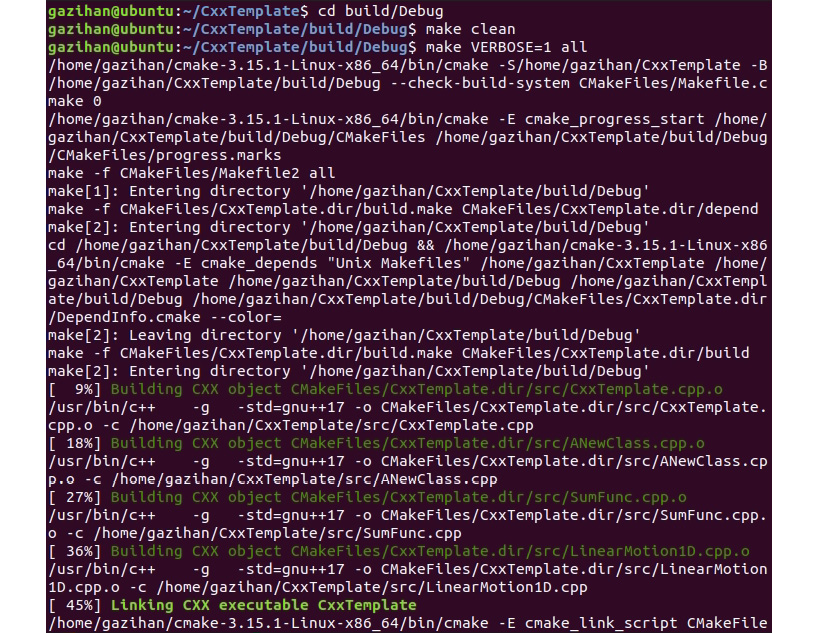
You will get a detailed output of the build process in the terminal, which may look a bit crowded:
Figure 1.35: The build process part 1
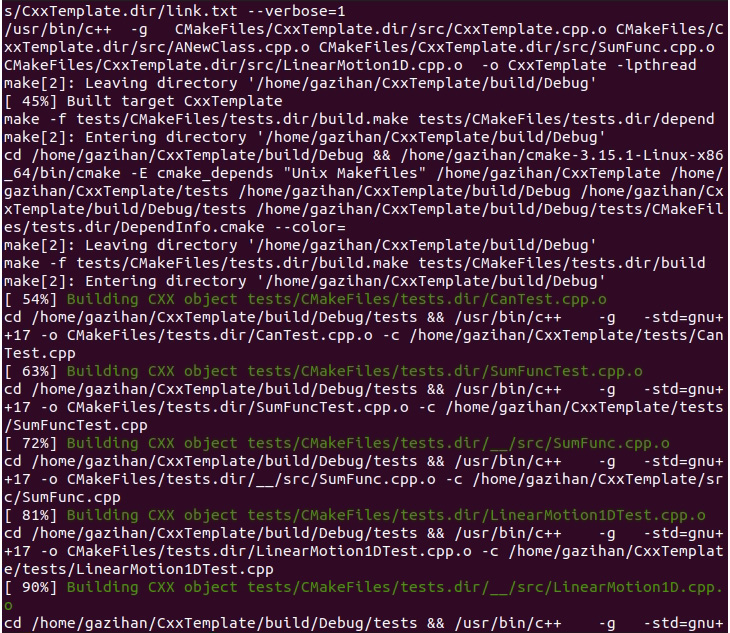
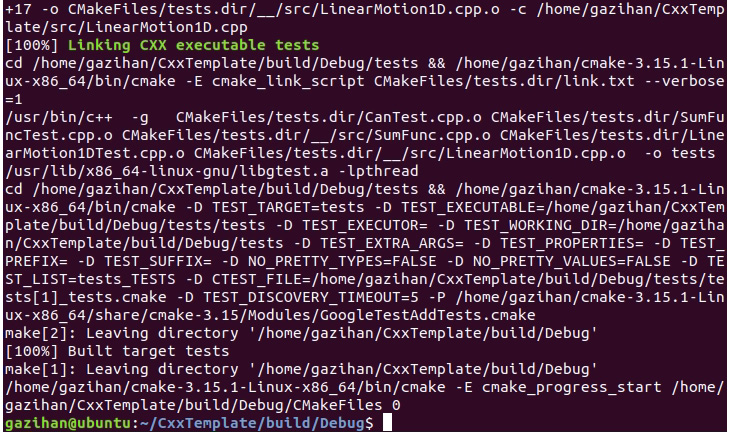
Figure 1.36: The build process part 2
Figure 1.37: The full build output
Here are some of the lines from this output. The following lines are the important ones related to the compilation and linkage of the main executable:
/usr/bin/c++    -g   -pthread -std=gnu++1z -o CMakeFiles/CxxTemplate.dir/src/CxxTemplate.cpp.o -c /home/username/Packt/Cpp2019/CxxTemplate/src/CxxTemplate.cpp
/usr/bin/c++    -g   -pthread -std=gnu++1z -o CMakeFiles/CxxTemplate.dir/src/ANewClass.cpp.o -c /home/username/Packt/Cpp2019/CxxTemplate/src/ANewClass.cpp
/usr/bin/c++    -g   -pthread -std=gnu++1z -o CMakeFiles/CxxTemplate.dir/src/SumFunc.cpp.o -c /home/username/Packt/Cpp2019/CxxTemplate/src/SumFunc.cpp
/usr/bin/c++    -g   -pthread -std=gnu++1z -o CMakeFiles/CxxTemplate.dir/src/LinearMotion1D.cpp.o -c /home/username/Packt/Cpp2019/CxxTemplate/src/LinearMotion1D.cpp
/usr/bin/c++  -g   CMakeFiles/CxxTemplate.dir/src/CxxTemplate.cpp.o CMakeFiles/CxxTemplate.dir/src/ANewClass.cpp.o CMakeFiles/CxxTemplate.dir/src/SumFunc.cpp.o CMakeFiles/CxxTemplate.dir/src/LinearMotion1D.cpp.o  -o CxxTemplate -lpthread
- The
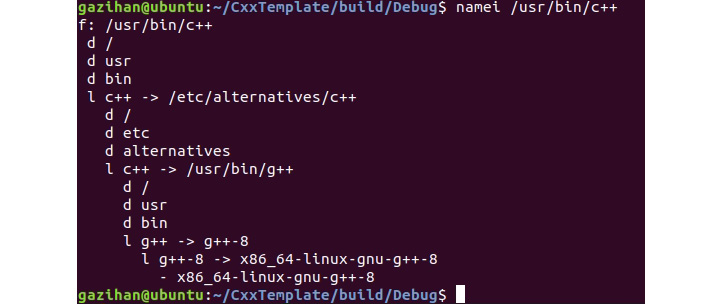
c++ command here is just a symbolic link to the g++ compiler. To see that it's actually a chain of symbolic links, type the following command:namei /usr/bin/c++
You will see the following output:
Figure 1.38: The chain of symbolic links for /usr/bin/c++
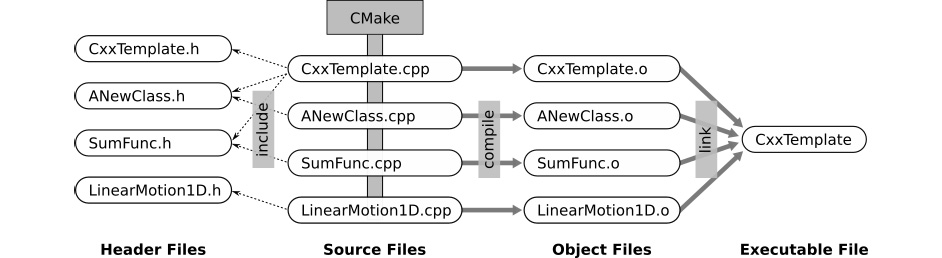
Therefore, we will use c++ and g++ interchangeably throughout our discussion. In the build output that we quoted earlier, the first four lines are compiling each .cpp source file and creating the corresponding .o object file. The last line is linking together these object files to create the CxxTemplate executable. The following figure visually presents this process:
Figure 1.39: Execution stages of a C++ project
As the previous figure shows, the CPP files that are added to CMake as a part of a target, along with the header files that they included, are compiled to object files, which are later linked together to create the target executable.
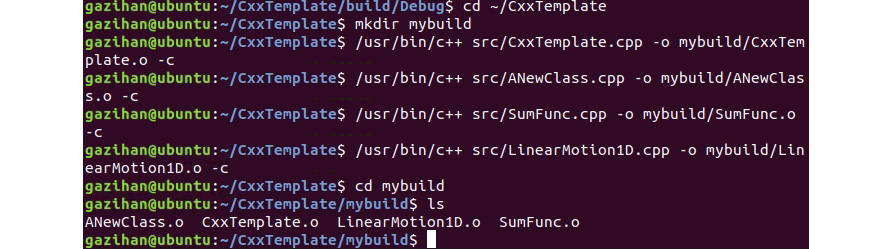
- To understand this process even further, let's carry out the compilation steps ourselves. In the terminal, go to the project folder and create a new folder named
mybuild using the following commands:cd ~/CxxTemplate
mkdir mybuild
- Then, run the following commands to compile the CPP source files to object files:
/usr/bin/c++ src/CxxTemplate.cpp -o mybuild/CxxTemplate.o -c
/usr/bin/c++ src/ANewClass.cpp -o mybuild/ANewClass.o -c
/usr/bin/c++ src/SumFunc.cpp -o mybuild/SumFunc.o -c
/usr/bin/c++ src/LinearMotion1D.cpp -o mybuild/LinearMotion1D.o -c
- Go into the
mybuild directory and see what's there using the following command:cd mybuild
ls
We see the following output as expected. These are our object files:
Figure 1.40: Compiled object files
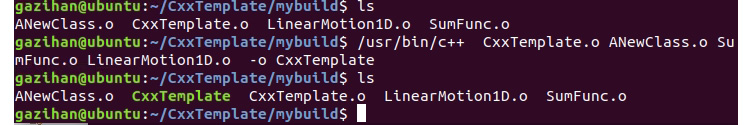
- In the next step, link the object files together to form our executable. Type the following command:
/usr/bin/c++ CxxTemplate.o ANewClass.o SumFunc.o LinearMotion1D.o -o CxxTemplate
- Now, let's see our executable among the list of files here by typing the following command:
ls
This shows the new CxxTemplate file in the following figure:
Figure 1.41: Linked executable file
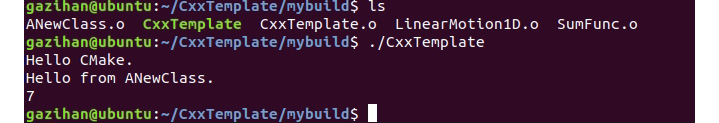
- Now, run our executable by typing the following command:
./CxxTemplate
And see the output that we had before:
Figure 1.42: Executable file output
Now that you have examined the details of the build process and have recreated them yourself, in the next section, let's explore the linking process.
The Linking Step
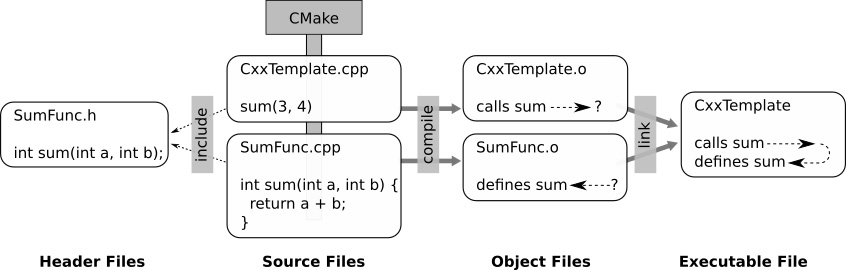
In this section, let's look at a connection between two source files and how they end up in the same executable. Look at the sum function in the following figure:
Figure 1.43: The linking process
The sum function's body is defined in SumFunc.cpp. It has a forward declaration in SumFunc.h. This way, the source files that want to use the sum function can know about its signature. Once they know its signature, they can call it and trust that the actual function definition will be there during runtime, without actually having any interaction with SumFunc.cpp where the function is defined.
After compilation, CxxTemplate.cpp, which calls the sum function, carries that call into its object file. Still, it does not know where the function definition is. The object file of SumFunc.cpp has that definition, but it has nothing to do with CxxTemplate.o, yet.
During the linking step, the linker matches the call in CxxTemplate.o with the definition in SumFunc.o. The call works fine in the executable as a result. Had the linker not found the definition of the sum function, it would have given a linker error.
The linker finds the sum function by its name and parameters. This is called resolving a symbol. The classes, functions, and variables defined in object files are placed in a symbol table and each reference to a symbol is resolved via a lookup at this table. When the symbol is not there, you receive a symbol could not be resolved error.
This took us through the two stages of the build process: compilation and linking. Notice that we used rather simpler commands compared to that of CMake, when we compiled our sources manually. Feel free to type man g++ to see all the options there. Later, we discussed linking and how symbols are resolved. We also talked about possible issues with the linking step. In the next section, we will learn about object files.
Diving Deeper: Viewing Object Files
For the linking step to work without errors, we need to have all our symbol references match our symbol definitions. Most of the time, we can analyze how things will be resolved just by looking at the source files. Sometimes, in complex situations, we may have a difficult time understanding why a symbol is not being resolved. In such situations, looking at the contents of object files to investigate references and definitions can be useful to resolve the problem. Besides linker errors, understanding object file contents and how linking works in general is useful for a C++ programmer. Knowing what is happening under the hood may help programmers understand the whole process in a better way.
When our source code is compiled to object files, our statements and expressions are converted to assembly code, which is the low-level language that the CPU understands. Each instruction in assembly contains an operation, followed by operators, which are registers of the CPU. There are instructions to load data to and from registers and operate on values in registers. The objdump command in Linux helps us view the contents of these object files.
Note
We will utilize Compiler Explorer, a nice online tool that is easier to use, where you can write code on the window to the left, and on the right, you can see the compiled assembly code. Here is the link to the Compiler Explorer: https://godbolt.org.
Exercise 8: Exploring Compiled Code
In this exercise, we will use Compiler Explorer to compile some simple C++ code in which we define and call a function. We will investigate the compiled assembly code to understand how exactly names are resolved and calls are made. This will give us a better understanding of what happens under the hood and how our code works in the executable format. Perform the following steps to complete the exercise:
- Add the following code in Compiler Explorer:
int sum(int a, int b) {
return a + b;
}
int callSum() {
return sum(4, 5);
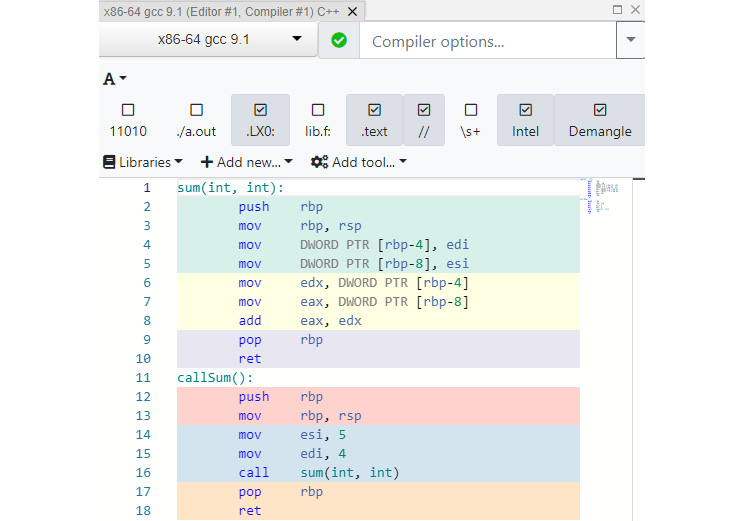
}We have two functions; one is calling the other. Here is the compiled output:
Figure 1.44: The compiled code
While it's not very clear, you can more or less make out what it is doing. We are not going to dive into the details of assembly code, but we will focus on how symbols are resolved during the linker stage. Let's focus on the following lines for now:
sum(int, int):

...
callSum():

...
        call  sum(int, int)

...
The call sum(int, int) line does what you expect: it calls the preceding sum function and places the arguments in some registers. The important point here is that the functions are identified by their names and the types of their parameters in order. The linker looks for the appropriate function with this signature. Note that the return value is not a part of the signature.
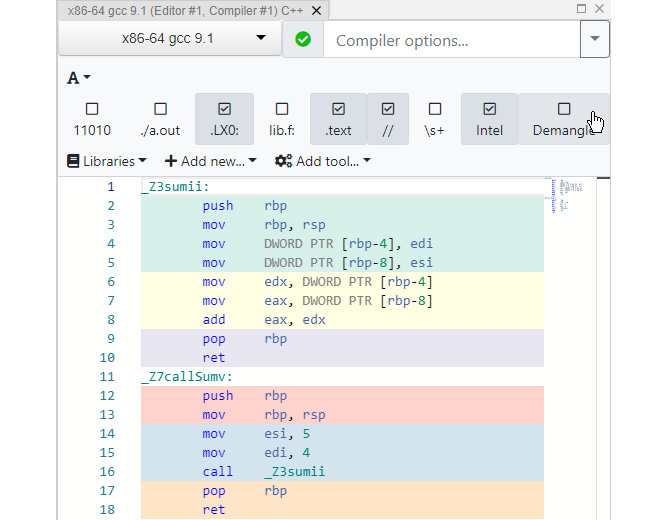
- Disable the Demangle checkbox and see how these function names are actually stored:
Figure 1.45: Compiled code without demangling
Here, our lines became this:
_Z3sumii:

...
_Z7callSumv:

...
        call    _Z3sumii

...
The preceding are the mangled names of these functions. After _Z, the number tells us how long the function name is, so that the following letters are correctly interpreted. After the function name, we have v for no parameters and i for an int parameter. You can change these function signatures to view other possible types.
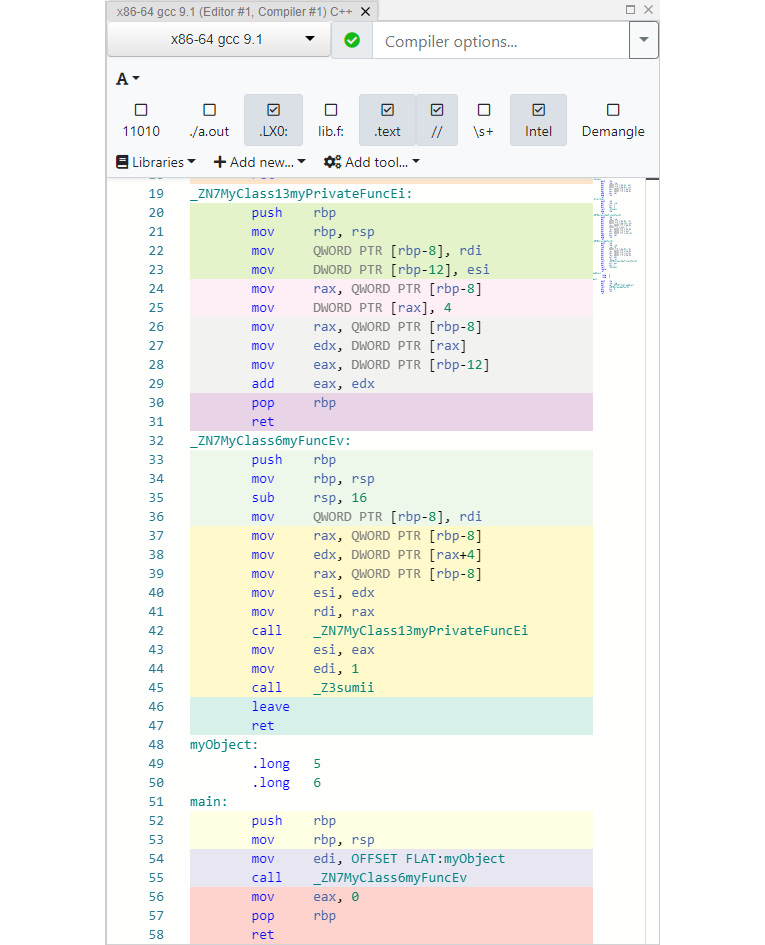
- Now, let's look at how classes are compiled. Add the following code into Compiler Explorer under the existing code:
class MyClass {
private:
    int a = 5;
    int myPrivateFunc(int i) {
        a = 4;
        return i + a;
    }
public:
    int b = 6;
    int myFunc(){
        return sum(1, myPrivateFunc(b));
    }
};
MyClass myObject;
int main() {
    myObject.myFunc();
}
Here is the compiled version of these added lines:
Figure 1.46: The compiled version
You may be surprised that there is no class definition in the compiled code. The methods are similar to global functions, but with a twist: their mangled names contain the class name and they receive the object instance as a parameter. Creating an instance simply allocates space for the fields of the class.
During the linker phase, these mangled function names are used to match callers with callees. For callers that cannot find a callee, we get linker errors. Most linker errors can be resolved by carefully checking sources. However, in some cases, viewing the object file contents with objdump can help get to the bottom of the problem.


 Free Chapter