Book Image

Microsoft Dynamics CRM 2011 Reporting

By : Damian Hernan Sinay
Book Image

Microsoft Dynamics CRM 2011 Reporting

By: Damian Hernan Sinay

Overview of this book

All of the data entered into a CRM means nothing if it is unable to report the important information to our managers and executives in such a way that they can easily and quickly get the results they need. A better reporting system would enable them to make the necessary improvements to the processes that any business needs in a dynamic business world.For users and developers wishing to take advantage of using the report capabilities of Dynamics CRM, this is the book for you. Microsoft Dynamics CRM 2011 Reporting is a practical and excellent reference guide that provides you with a number of different options you can use to create and empower the Reporting capabilities of Dynamics CRM. This will give you a good grounding in using the reports in your Dynamics CRM 2011 implementations. This book looks at all the different options we can use to create reports in Dynamics CRM 2011, starting with SQL Reporting Services and custom reports, created in either CRM Report Wizard, SQL Report Builder, or Visual Studio. It will also show other options we can use such as dashboards, charts, and different ways to optimize and automate reports.We will also learn how to build our own reports either using the different wizards for basic reports or using Visual Studio for more complex reports. We will explore the options mobile CRM users have who want to run and see reports on these mobile devices.
Table of Contents (18 chapters)
Microsoft Dynamics CRM 2011 Reporting
Credits
About the Author
About the Reviewers
www.PacktPub.com
Preface
Index

Charts


When working with Visual Studio we can add more powerful charts with more options than the ones presented with the Report Wizard or the Report Builder applications. We are going to create a simple report to show as an example:

  1. Drag-and-drop a chart control that is available in the toolbox. We will be presented with a dialog box as shown in the following screenshot:

  2. For this sample we will select the first chart under the Column section and click on OK.

  3. Click on the columns to configure the fields we want to be displayed. That should open the following properties window to the right of the chart control:

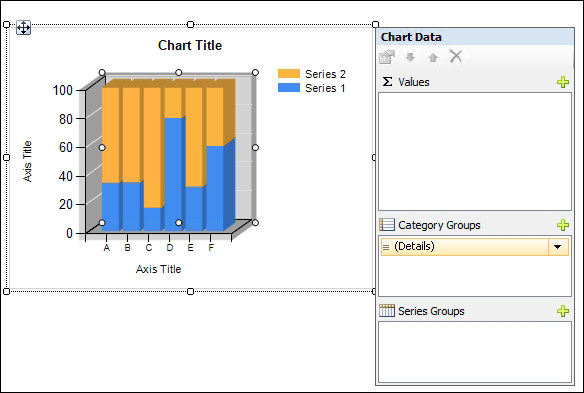
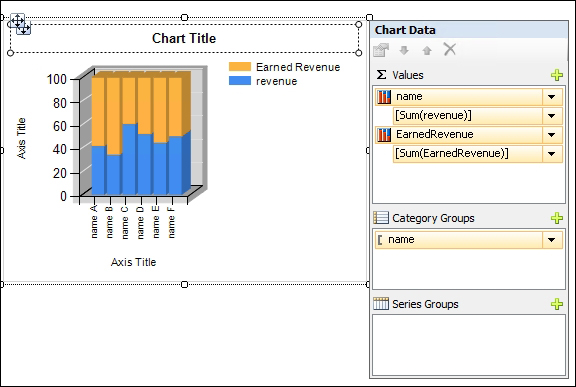
  4. Click on the plus sign under the ∑ Values list, so that we can select the fields that we want to use for aggregation. In this example, we will add Name and EarnedRevenue. Notice we can also use an expression if we want to create something more complex.

  5. We can add different groups of series to display more than one aggregated field by using the Category Groups and Series Groups.

  6. Setting the...