
In this recipe, we will see how to work with DataTips during debugging. DataTips are individual data elements that can be seen on the editor when the program is debugged. They are advanced tooltip messages that can inspect objects and variables running in the current context.
Let's now see how to use DataTips with the following simple steps:
Place a breakpoint in the program and run it.
Hover over an object instance in the code or a variable to open a tooltip associated with the object.
A tooltip is a tree of members that can be expanded over the editor. You can toggle one object directly using the toggle button on the right-hand side of each object/value.
The pinned objects are placed on the screen and can be dragged inside the editor or you can even add comments on the toggled DataTips, as shown in the following screenshot:
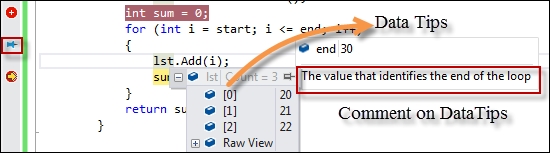
While debugging, the value changes to a contextual value while the last value is restored when the debug session is over. You can view the last value by hovering over the left-hand gutter, which leaves behind a blue-colored anchor pin.
DataTips actually use the data type information about an object to display each value. Each object has a type associated with it. The debugger analyzes the type information about the object and recursively loads all the object information in the form of a hierarchical structure in the same way as we programmatically do using reflection APIs.
The IDE stores the DataTip information in persistent storage but not the data that represents the state of a program.
Let's now explore some of the additional options that are available on DataTips for the IDE.
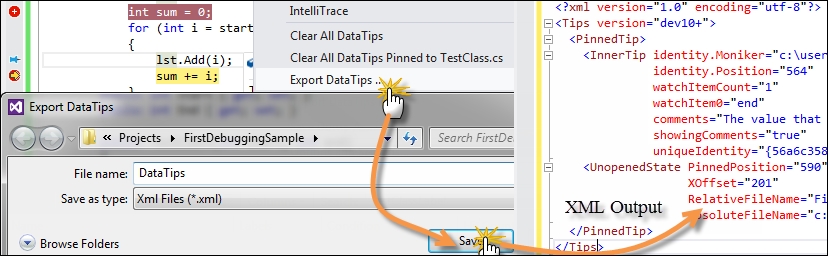
DataTips can be imported or exported just like breakpoints. From the main menu, go to Debug | Export DataTips. It will show you a dialog box to store the DataTips in a file as shown in the following screenshot. Once the DataTips are stored in the file, you can open it to see its content. It's a SOAP-based XML file with all the information that is required to reload the DataTips again to a certain point. For instance, your comments or watched items will be kept intact in an XML file using tags such as Comments or WatchItem#. You can add any item as watch using the right-click context menu. The following screenshot shows the XML output on the right-hand side:
Once the file has been exported, Visual Studio can import the file in another Visual Studio IDE or in the same one and load the same environment of the DataTips when needed.
DataTips are really helpful for debugging and testing a large project.
DataTips can be cleared either by dismissing each individual DataTip or using the Debug menu. You have the following two options:
Clear All DataTips: This clears DataTips from all over the solution
Clear All DataTips pinned to [FileName]: This clears DataTips associated only to the current file
While debugging complex objects, the debugger is associated with a number of visualizers that help in displaying complex structures in better ways.
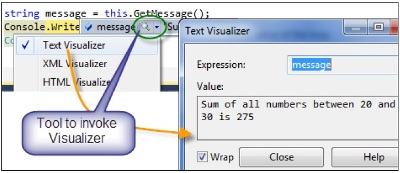
The visualizer creates a dialog box that appears on the Visual Studio IDE when an appropriate data type is loaded on the debugger. For instance, for a string instance, we generally have three visualizers associated. The Text Visualizer shows the string in the text format in a new window, as shown in the following screenshot. If the string content is XML, you can see the content in the associated XML visualizer and the HTML visualizer.
The debugger visualizer is associated with the data type of a class and is shown corresponding to either its loaded DataTips or in Watch windows. We can use a number of visualizers for a certain data type. We will see how to create a custom debugger visualizer later in this book.
Watch windows are places where you investigate objects just like DataTips. It is an alternative to DataTips. There are various types of Watch windows.
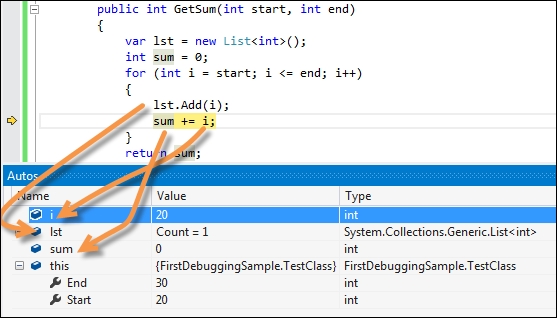
When the debugger hits a breakpoint, the Autos window shows all the objects and variables that are used in producing the current statement or items in context. Visual Studio automatically identifies the variables for you and shows them in this window. References are also listed inside Autos implicitly, as shown in the following screenshot:
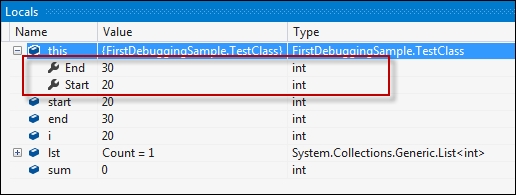
Locals are variables that are local to the current context and thread of execution. You can view and modify the value of a variable in the break mode using Locals, as shown in the following screenshot. The Locals window updates its value when the program is in the break mode.
Watch windows are customized windows that show objects and variables based on what users customize. While in the break mode, you can right-click on any variable and select Add to watch to add the selected object in the Watch window. You can also drag-and-drop expressions in the Watch window. Notably, there are actually four Watch windows available in Visual Studio to separate variables from one another, and to ensure that you can group similar objects in a Watch window when dealing with a large number of variables at the same time.
Generally, when you right-click and select Add to watch, an object will always be added to the Watch 1 window, but you can drag the expression from Watch 1 to any of the Watch windows.
In the following screenshot, you can see four Watch windows; each of them capable of showing variables in sync. The Watch windows show a grid with the Name, Value, and Type of each expression. You can directly type the value of a variable inside the Watch windows to change the value of the watched variable. Watch windows are also capable of showing calculated values.
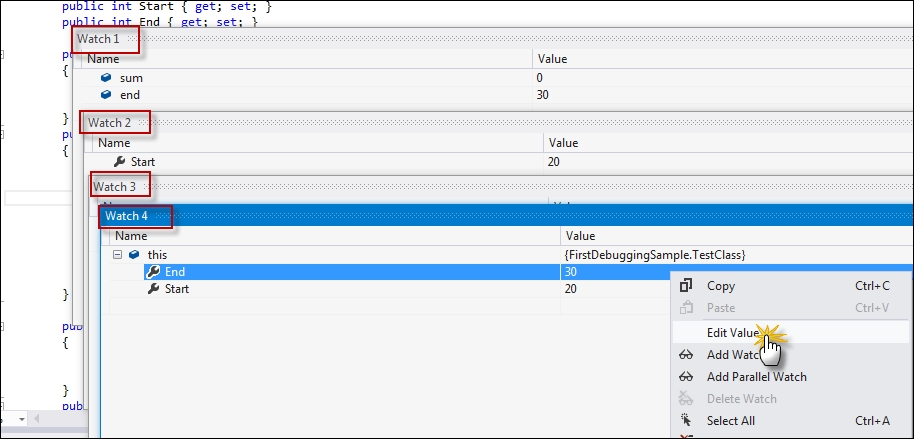
Like all other windows, Watch windows also show a tree when a complex object is loaded onto it. For instance, an object of a class in the preceding screenshot shows its properties inside a tree.
You can create an object ID of an object or variable from inside a Watch window as well. An object ID is an aliasing mechanism to edit the value of a variable using an identifier. Objects with object IDs can be accessed directly in all debugging tools (immediate window, command window, watch window, and so on). Right-click on any object in the Watch window and select Make Object ID, as shown in the following screenshot:
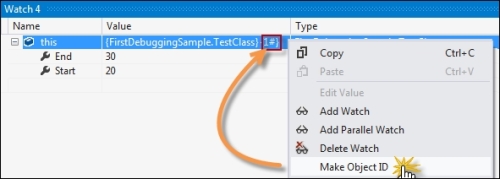
Once the object ID is created, Visual Studio puts a n# number corresponding to the variable that can be tracked easily by calling it later.
Another important tool window that is most often required by any debugging session is the Error List window. After you build your project, this window appears automatically to show any errors, warnings, or information that you need to know. You can move the cursor to the exact location with details when we double-click on any record from the error list. The error list displays a description of the message, the file where the error occurred, column number, line number, and the project name.
You can toggle errors, warnings, and even messages. It also provides you with a search box to search in case the error list is pretty long, as shown in the following screenshot:
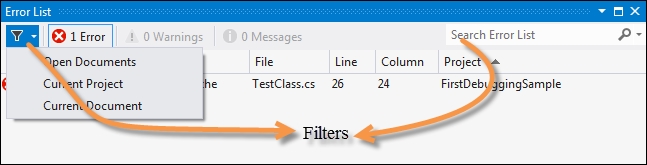
The Error List window also allows you to filter errors on Open Documents, Current Project, and even Current Document.