

IntelliTrace is another great feature of the Visual Studio IDE. IntelliTrace debugging is sometimes called historical debugging. It operates in the background and records each and every thing you do during debugging. IntelliTrace traces all the information for all the events that occur during debugging and you can get information for all those tasks when required.
Let's demonstrate how to use IntelliTrace while debugging inside Visual Studio:
Once the debugger has started, open IntelliTrace in the Debug menu if you don't see it opened already.
After running a couple of steps in the code, you can see the debugger IntelliTrace logs in the IntelliTrace tool window.
Open each window to inspect each event status.

Each of the blocks contain Call Stack information and a Locals set, as shown in the preceding screenshot. The command opens its respective tool window with appropriate data. The editor also gets highlighted when a particular event is highlighted in IntelliTrace.
You can filter IntelliTrace logs by choosing the appropriate categories and threads.
IntelliTrace traces each of the events that go on with the program during debugging and produces trace files of the .itrace extension. Debugging more will increase the size of the file. The IntelliTrace files are by default stored in your hard drive. To see where these files are stored, navigate to Tools | Options | IntelliTrace | Advanced, or simply type IntelliTrace and navigate to IntelliTrace | Advanced, as shown in the following screenshot:
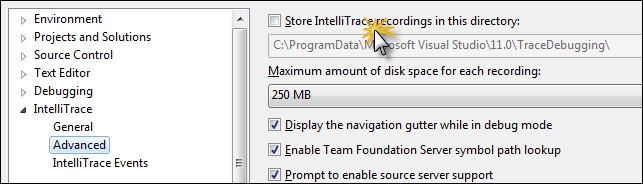
In this dialog box, you can configure how much IntelliTrace debug information needs to be stored. You can uncheck the option to stop storing the IntelliTrace debugger information.
You can go to the filesystem and select the Store IntelliTrace in this directory option to choose the TraceDebugging directory.
Now let's look into some of the other interesting features of IntelliTrace that we may have missed.
An IntelliTrace file can be saved directly to the hard drive (.itrace) by choosing the Save button from the tool window. When you choose the Save button, it prompts the location where you want to save the content. Once you save the content, you can double-click and reopen the content in Visual Studio to get the entire report of the debugging session.
In the report, it produces a neat graph of the complete execution of the application with all the modules that are loaded, the entire system info, exceptions occurred during execution (if any), test data (if any), and the threads. It also lists the web requests that are made from the application, as shown in the following screenshot:
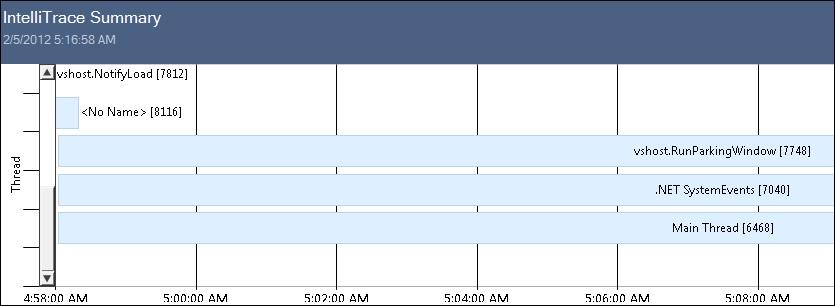
The IntelliTrace logs are so elaborate that the IDE can produce the same environment when you double-click on the any of the threads (or in particular, the main thread).
As we can see, IntelliTrace files are considerable in size; we can filter them to log trace information only to the modules specific to our requirement. Go to Tools | Options and then IntelliTrace | Modules, or directly type IntelliTrace in the IDE search box and type IntelliTrace to open the following screen:
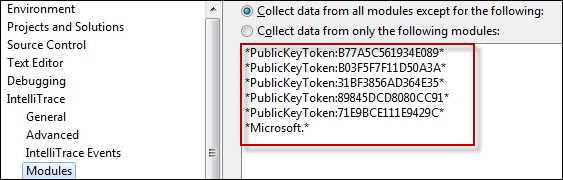
To capture data, you can choose either the modules you want except the listed modules or the reverse based on the radio button you choose. Generally, we bother only about our own code. Let's select the first radio button and then select the Add button. Specify the filename that you need to omit the IntelliTrace information from and select OK.
To test our application, we will create a new dll and write the name of the dll in the Add a Pattern dialog box. Now, when you debug the code, the detailed information for the calls to the dll will be missing.
Debugger Canvas is another interesting tool for advanced debugging. It is actually built on top of IntelliTrace and helps in getting all the information about debugging in one single instance.
To work with Debugger Canvas, you need to install it from the following location: http://bit.ly/debuggercanvas.
Once you install Debugger Canvas to the IDE, you can open a new canvas by navigating to Debug | Debugger Canvas | Create New Canvas. Now let's put a breakpoint in the code and run the program.
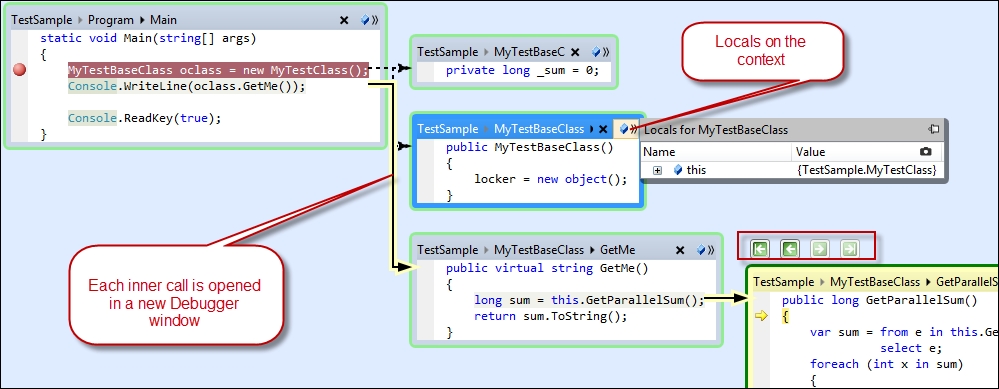
You can see that the code is now shown inside Debugger Canvas on the IDE. On choosing Step Into from the menu or pressing F11, it produces another box with the code where the cursor is moved to. There are navigation keys to move back and forth between these windows.
Debugger Canvas is helpful at times when you want to see the entire call stack of the code and easily move back from one call stack to another easily. Debugger Canvas also has an option in the right-hand side corner of each canvas element, which shows the locals of the current execution block as seen in the preceding screenshot.