

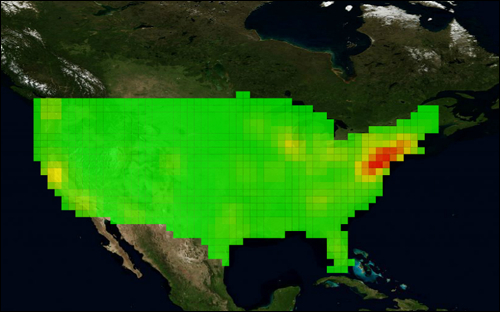
For this recipe we are going to overlay a heat map over a map layer. This is a bit more challenging than what we did before but it should go smoothly as the concept is not that complex. Heat maps are used to represent density over a region by adding different colors over certain areas. In the case, we are going to display the number of animal specimens over the area of the United States using the Global Biodiversity Information Facility's data.
Open the files from the code downloaded from the Packt Publishing web site in the folder Chapter 6 and within that, Recipe 6.
The following are the steps required to overlay a heat map on a map:
First get over to the gbif.org website to download an XML file with the US data in it. The URL is given as http://es.mirror.gbif.org/ws/rest/density/list?originisocountrycode=US.
Remove the extra markup in the XML file just so that it would be easier to parse it in ActionScript.
Embed the XML file in the
Main...