Overview of this book
Ceph is a unified, distributed storage system designed for excellent performance, reliability, and scalability. This cutting-edge technology has been transforming the storage industry, and is evolving rapidly as a leader in software-defined storage space, extending full support to cloud platforms such as Openstack and Cloudstack, including virtualization platforms. It is the most popular storage backend for Openstack, public, and private clouds, so is the first choice for a storage solution. Ceph is backed by RedHat and is developed by a thriving open source community of individual developers as well as several companies across the globe.
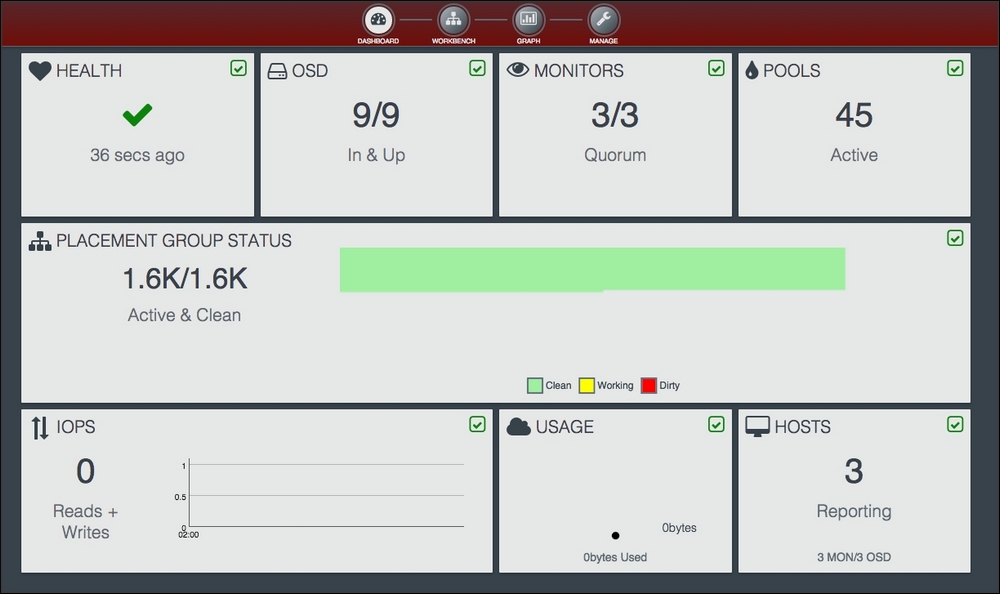
This book takes you from a basic knowledge of Ceph to an expert understanding of the most advanced features, walking you through building up a production-grade Ceph storage cluster and helping you develop all the skills you need to plan, deploy, and effectively manage your Ceph cluster. Beginning with the basics, you’ll create a Ceph cluster, followed by block, object, and file storage provisioning. Next, you’ll get a step-by-step tutorial on integrating it with OpenStack and building a Dropbox-like object storage solution. We’ll also take a look at federated architecture and CephFS, and you’ll dive into Calamari and VSM for monitoring the Ceph environment. You’ll develop expert knowledge on troubleshooting and benchmarking your Ceph storage cluster. Finally, you’ll get to grips with the best practices to operate Ceph in a production environment.


