
In the last recipe of this chapter, we will explore the different methods available to debug problems with the build system and its metadata.
Let's first introduce some of the usual use cases on a debugging session.
A good way to check whether a specific package is supported in your current layers is to search for it as follows:
$ find -name "*busybox*"
This will recursively search all layers for the BusyBox pattern. You can limit the search to recipes and append files by executing:
$ find -name "*busybox*.bb*"
When developing or debugging package or image recipes, it is very common to ask BitBake to list its environment both globally and for a specific target, be it a package or image.
To dump the global environment and grep for a variable of interest (for example, DISTRO_FEATURES), use the following command:
$ bitbake -e | grep -w DISTRO_FEATURES
Optionally, to locate the source directory for a specific package recipe like BusyBox, use the following command:
$ bitbake -e busybox | grep ^S=
You could also execute the following command to locate the working directory for a package or image recipe:
$ bitbake -e <target> | grep ^WORKDIR=
BitBake offers the devshell task to help developers. It is executed with the following command:
$ bitbake -c devshell <target>
It will unpack and patch the source, and open a new terminal (it will autodetect your terminal type or it can be set with OE_TERMINAL) in the target source directory, which has the environment correctly setup.
Note
While in a graphical environment, devshell opens a new terminal or console window, but if we are working on a non-graphical environment, like telnet or SSH, you may need to specify screen as your terminal in your conf/local.conf configuration file as follows:
OE_TERMINAL = "screen"
Inside the devshell, you can run development commands like configure and make or invoke the cross-compiler directly (use the $CC environment variable, which has been set up already).
The starting point for debugging a package build error is the BitBake error message printed on the build process. This will usually point us to the task that failed to build.
To list all the tasks available for a given recipe, with descriptions, we execute the following:
$ bitbake -c listtasks <target>
If you need to recreate the error, you can force a build with the following:
$ bitbake -f <target>
Or you can ask BitBake to force-run only a specific task using the following command:
$ bitbake -c compile -f <target>
To debug the build errors, BitBake creates two types of useful files per shell task and stores them in a temp folder in the working directory. Taking BusyBox as an example, we would look into:
/opt/yocto/fsl-community-bsp/wandboard-quad/tmp/work/cortexa9hf- vfp-neon-poky-linux-gnueabi/busybox/1.22.1-r32/temp
And find a list of log and run files. The filename format is
log.do_<task>.<pid>
and run.do_<task>.<pid>.
But luckily, we also have symbolic links, without the pid part, that link to the latest version.
The log files will contain the output of the task, and that is usually the only information we need to debug the problem. The run file contains the actual code executed by BitBake to generate the log mentioned before. This is only needed when debugging complex build issues.
Python tasks, on the other hand, do not currently write files as described previously, although it is planned to do so in the future. Python tasks execute internally and log information to the terminal.
BitBake recipes accept either bash or Python code. Python logging is done through the bb class and uses the standard logging Python library module. It has the following components:
bb.plain: This useslogger.plain. It can be used for debugging, but should not be committed to the source.bb.note: This useslogger.info.bb.warn: This useslogger.warn.bb.error: This useslogger.error.bb.fatal: This useslogger.criticaland exits BitBake.bb.debug: This should be passed log level as the first argument and useslogger.debug.
To print debug output from bash in our recipes, we need to use the logging class by executing:
inherit logging
The logging class is inherited by default by all recipes containing base.bbclass, so we don't usually have to inherit it explicitly. We will then have access to the following bash functions, which will output to the log files (not to the console) in the temp directory inside the working directory as described previously:
bbplain: This function outputs literally what's passed in. It can be used in debugging but should not be committed to a recipe source.bbnote: This function prints with theNOTEprefix.bbwarn: This prints a non-fatal warning with theWARNINGprefix.bberror: This prints a non-fatal error with theERRORprefix.bbfatal: This function halts the build and prints an error message as withbberror.bbdebug: This function prints debug messages with log level passed as the first argument. It is used with the following format:bbdebug [123] "message"
You can ask BitBake to print the current and provided versions of packages with the following command:
$ bitbake --show-versions
Another common debugging task is the removal of unwanted dependencies.
To see an overview of pulled-in dependencies, you can use BitBake's verbose output by running this:
$ bitbake -v <target>
To analyze what dependencies are pulled in by a package, we can ask BitBake to create DOT files that describe these dependencies by running the following:
$ bitbake -g <target>
The DOT format is a text description language for graphics that is understood by the GraphViz open source package and all the utilities that use it. DOT files can be visualized or further processed.
You can omit dependencies from the graph to produce more readable output. For example, to omit dependencies from glibc, you would run the following command:
$ bitbake -g <target> -I glibc
Once the preceding commands have been run, we get three files in the current directory:
package-depends.dot: This file shows the dependencies between runtime targetspn-depends.dot: This file shows the dependencies between recipestask-depends.dot: This file shows the dependencies between tasks
There is also a pn-buildlist file with a list of packages that would be built by the given target.
To convert the .dot files to postscript files (.ps), you may execute:
$ dot -Tps filename.dot -o outfile.ps
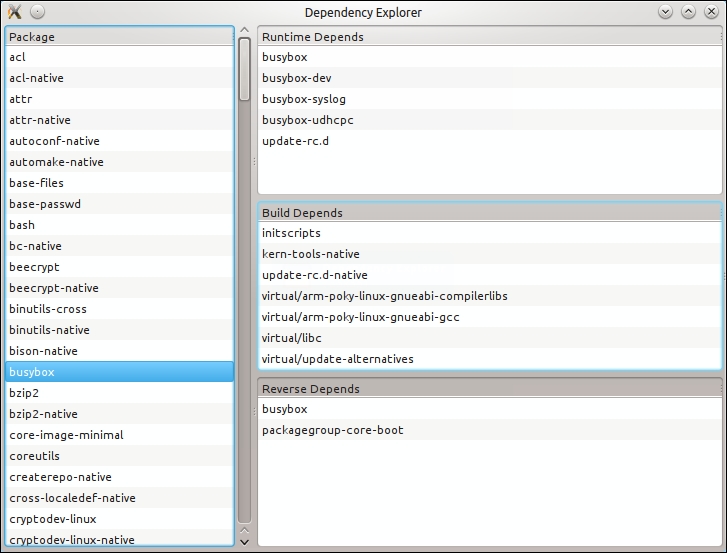
However, the most useful way to display dependency data is to ask BitBake to display it graphically with the dependency explorer, as follows:
$ bitbake -g -u depexp <target>
The result may be seen in the following screenshot:
It is not common to have to debug BitBake itself, but you may find a bug in BitBake and want to explore it by yourself before reporting it to the BitBake community. For such cases, you can ask BitBake to output the debug information at three different levels with the -D flag. To display all the debug information, run the following command:
$ bitbake -DDD <target>
Sometimes, you will find a build error on a Yocto recipe that you have not modified. The first place to check for errors is the community itself, but before launching your mail client, head to http://errors.yoctoproject.org.
This is a central database of user-reported errors. Here, you may check whether someone else is experiencing the same problem.
You can submit your own build failure to the database to help the community debug the problem. To do so, you may use the report-error class. Add the following to your conf/local.conf file:
INHERIT += "report-error"
By default, the error information is stored under tmp/log/error-report under the build directory, but you can set a specific location with the ERR_REPORT_DIR variable.
When the error reporting tool is activated, a build error will be captured in a file in the error-report folder. The build output will also print a command to send the error log to the server:
$ send-error-report ${LOG_DIR}/error-report/error-report_${TSTAMP}
When this command is executed, it will report back with a link to the upstream error.
You can set up a local error server, and use that instead by passing a server argument. The error server code and setting up details can be found at http://git.yoctoproject.org/cgit/cgit.cgi/error-report-web/tree/README.
Although you can use Linux utilities to parse Yocto's metadata and build output, BitBake lacks a command base UI for common tasks. One project that aims to provide it is bb, which is available at https://github.com/kergoth/bb.
To use it, you need to clone the repository locally by executing the following command:
$ cd /opt/yocto/fsl-community-bsp/sources
$ git clone https://github.com/kergoth/bb.git
Then run the bb/bin/bb init command, which prompts you to add a bash command to your ~/.bash_profile file.
You can either do that or execute it in your current shell as follows:
$ eval "$(/opt/yocto/fsl-community-bsp/sources/bb/bin/bb init -)"
You will first need to set up your environment as usual:
$ cd /opt/yocto/fsl-community-bsp
$ source setup-environment wandboard-quad
Note
Some of the commands only work with a populated work directory, so you may need to remove the rm_work class if you want to use bb.
Some of the tasks that are made easier by the bb utility are:
Exploring the contents of a package:
$ bb contents <target>Searching for a pattern in the recipes:
$ bb search <pattern>Displaying either the global BitBake environment or the environment for a specific package and grepping for a specific variable:
$ bb show -r <recipe> <variable>