
vRealize Operations collects data from objects in your environment. Each piece of data collected is called a metric observation, or value. Metrics can be grouped together in a vRealize Operations view.
Views are resource-type-specific, self-contained, reusable displays of information.
You have to define the resource type (or types) that you want to use as the "subjects" for the view. This is necessary so that you can select metrics that are specific to a resource type.
A view configuration is entirely independent of other views or settings. A view will display exactly the same everywhere it is used.
Due to their self-contained nature, and thanks to extensive integration points provided throughout vRealize Operations, views can be reused extensively. You can create valuable vRealize Operations views, and reuse them for every table or chart.
You can configure views to show transformation, trend, and forecast calculations:
- The transformation type determines how the values are aggregated.
- The trend option shows how the values tend to change, based on the historical raw data. The trend calculations depend on the transformation type and roll-up interval.
- The forecast option shows what the future values can be, based on the trend calculations of the historical data.
vRealize Operations provides several types of views. Each type of view helps you to interpret metrics, properties, policies of various monitored objects including alerts, symptoms, and so on, from a different perspective.
Views can be added to dashboards via the view widget. Dashboards present a visual overview of the performance and state of objects in your virtual infrastructure. You use dashboards to determine the nature and time frame of existing and potential issues with your environment.
Views are also the building blocks for reports. A report captures details related to current or predicted resource needs.
Used separately, or in reports, or dashboards, views can increase ROI in multiple ways.
Standalone views let you package up multiple key performance metrics into one view, removing the repetitive task of digging through metric menus. They are available for both parent and children resources, enabling you to quickly get key information for resources up and down the stack.
When used in reports, views increase your vRealize Operations ROI by combining vital configuration and performance information across your stack in a simple and reusable package. Report execution and delivery can also be automated, saving you even more time!
When used in dashboards, views allow you to define your resource KPIs in one place (the view), then reuse it elsewhere (reports and dashboards).
vRealize Operations has come a long way in recent years, but the more interesting and exciting features have come in the latest releases of the product. Here is a short overview of the new and enhanced features in the latest release of vRealize Operations, 6.6.
vRealize Operations offers simplified usability and faster time-to-value capabilities, as follows:
- A new HTML5 user interface provides an easier and consistent experience. The new UI is clarity-based, which is a standard used by all the products of VMware. This allows you to seamlessly go from one area of the solution to another, whether it is metrics, logs, or cost, without learning the menus or impacting your user experience.
- Consolidation and simpler grouping of menus, leading to the enhanced user experience.
- The Getting Started dashboard allows for quick navigation.
- Persona-based dashboards provide answers in one place. Dashboards are separated into categories such as Operations, Capacity and Utilization, Performance Troubleshooting, Workload Balance, and Configuration and Compliance.
- Out-of-the-box integration with vSAN, vRealize Log Insight, vRealize Business for Cloud, and vRealize Automation provides quick time to value:

It is optimized for SDDC management:
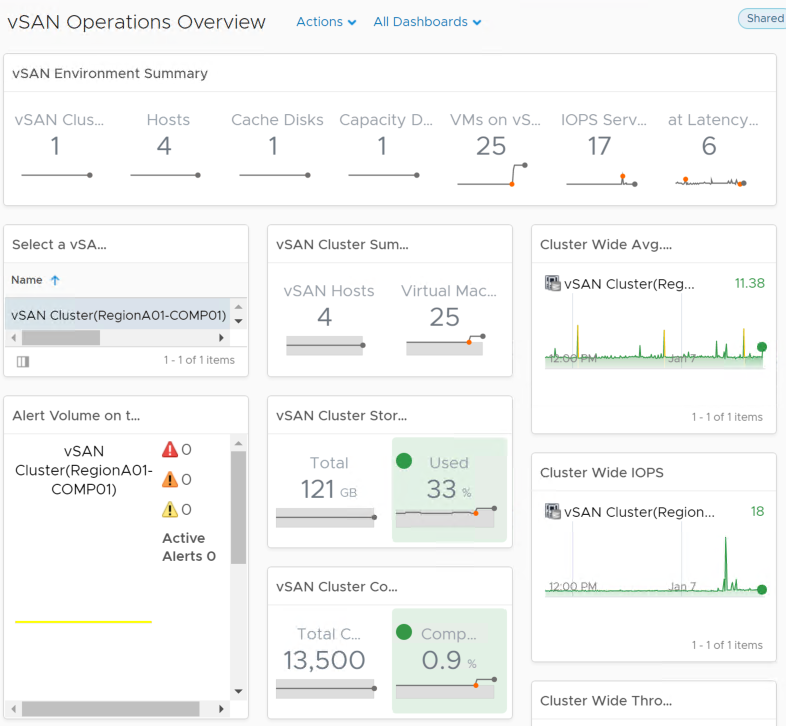
- Native vSAN management capabilities allow for centralized management across vSAN stretched clusters
- Ability for complete vSAN management, which includes administering performance, capacity, logs, and configuration and health
- Deploy vSAN with confidence with complete visibility down to disk level
- Operationalize vSAN with performance and capacity monitoring, including deduplication and compression benefits:
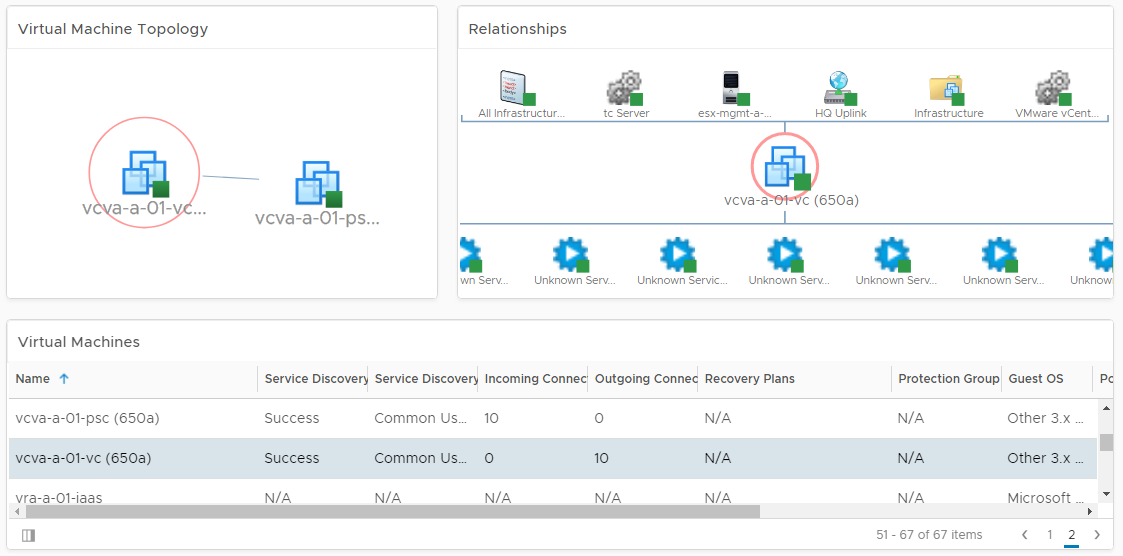
The Service Discovery Management Pack discovers all the services running in each VM and then builds a relationship or dependencies between services from different VMs, based on the network communication. The management pack can create dynamic applications based on the network communication between the services:
It has intelligent workload placement featuring fully automated workload balancing:
- Ensures performance across data centers with fully automated workload balancing, across clusters and across data stores (with storage vMotion)
- Ensures DRS configurations, and provides the option to set DRS automation level for individual objects
- Predictive DRS takes action to pre-empt resource contention
- Utilizes operations analytics to optimize initial placement of workloads through vRealize Automation:

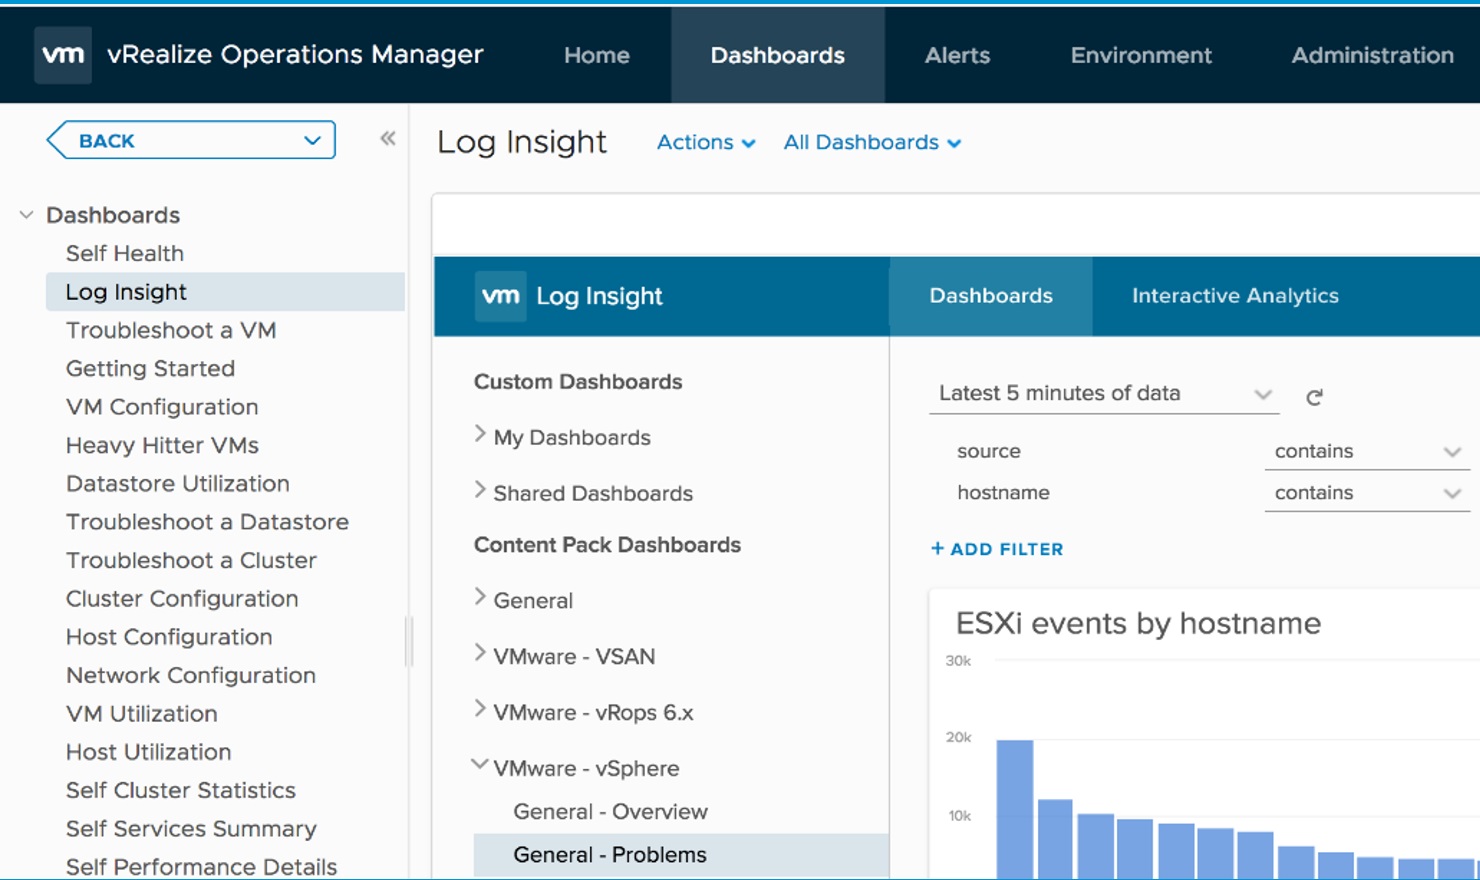
It has log integration:
- Full integration in-context within vRealize Operations for faster troubleshooting:
- Direct launch of the Log Insight dashboard
- Direct launch into Log Insight Interactive Analytics mode
- Object auto-initiated log management
- vRealize Operations alerts auto-initiated log management:
It enables cost management:
- Optimize public cloud spending with more visibility:
- Cost visibility: Costing analysis for all services on AWS and Azure
- Usage visibility: VM level usage visibility into public clouds
- Enhanced planning by correlating capacity and costs:
- Fine-grained cost analysis for private cloud
- Makes capacity optimization quantifiable
- Procurement planning
It has the following additional out-of-the-box compliance and hardening capabilities:
- Ability to tackle compliance problems through the new vSphere hardening dashboard
- Extends compliance through PCI and HIPAA compliance for vSphere
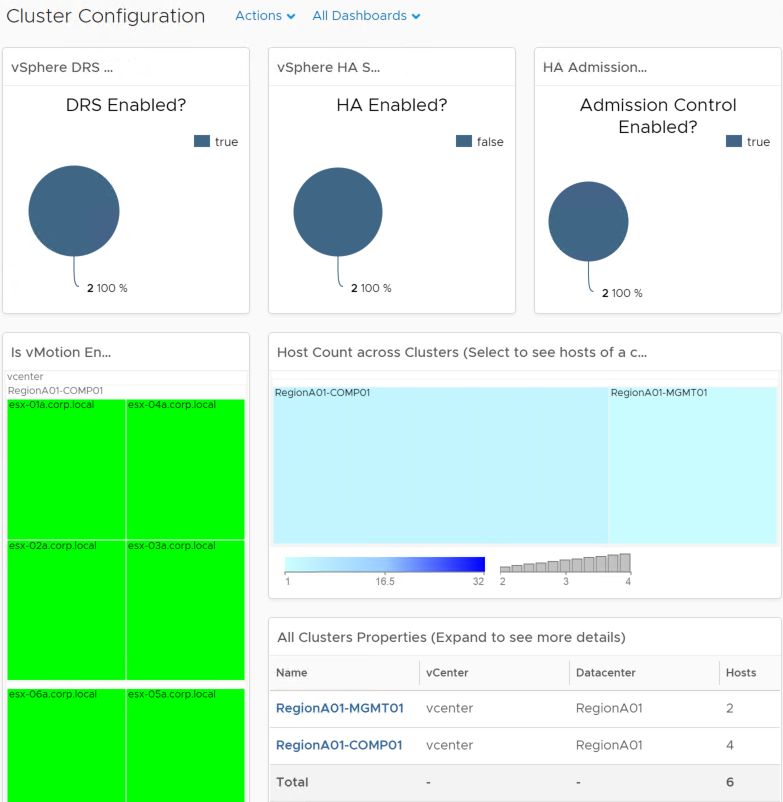
- Ensures business configurations through new cluster, host, and VM configuration dashboards:
It has sizing and scalability enhancements:
- You can now scale to six extra large nodes in a cluster, which can support up to 180,000 objects, and 45 million metrics
- You can now monitor up to 60 vCenter servers with a single instance of vRealize Operations
- A large remote Collector can support up to 15,000 objects