
To achieve the best performance in a consolidated environment, you must consider a ready time.
Ready time is the time that the vCPU waits, in the queue, for the pCPU (or physical Core) to be ready to execute its instruction. The scheduler handles the queue and when there is contention, and the processing resources are stressed, the queue might become long.
The ready time describes how much of the last observation period a specific world spent waiting in the queue. The ready time for a particular world (for example, a vCPU) is how much time during that interval was spent waiting in the queue to get access to a pCPU. The ready time can be expressed in percentage per vCPU over the observation time and statistically it can't be zero on average.
The value of the ready time, therefore, is an indicator of how long the VM was denied access to the pCPU resources which it wanted to use. This makes it a good indicator of performance.
When multiple processes are trying to use the same physical CPU, that CPU might not be immediately available, and a process must wait before the ESXi host can allocate a CPU to it.
The CPU scheduler manages access to the physical CPUs on the host system. A short spike in CPU used or CPU ready indicates that you are making the best use of the host resources. However, if both values are constantly high, the hosts are probably overloaded and performance is likely poor.
Generally, if the CPU used value for a virtual machine is above 90 percent and the CPU ready value is above 20 percent per vCPU (high number of vCPUs), performance is negatively affected.
This latency may impact the performance of the guest operating system and the running applications within a virtual machine.
To step through this recipe, you need a running ESXi Server, a couple of CPU-hungry virtual machines, VMware vCenter Server, and a working installation of vSphere Client. No other prerequisites are required.
Open up vSphere Client.
Log in to the VMware vCenter Server.
On the home screen, navigate to Hosts and Clusters.
Expand the left-hand navigation list.
Navigate to one of the CPU-hungry virtual machines.
Navigate to the Performance screen.
Navigate to the Advanced view.
Click on Chart Options.
Navigate to CPU from the Chart metrics.
Navigate to the VM object.
Select only Demand, Ready, and Usage in MHz.
The key metrics when investigating a potential CPU issue are:
Demand: Amount of CPU that the virtual machine is trying to use.
Usage: Amount of CPU that the virtual machine is actually being allowed to use.
Ready: Amount of time for which the virtual machine is ready to run but (has work it wants to do) but was unable to because vSphere could not find physical resources to run the virtual machine on.
Click on Ok.
In the following screenshot you will see the high ready time for the virtual machine:
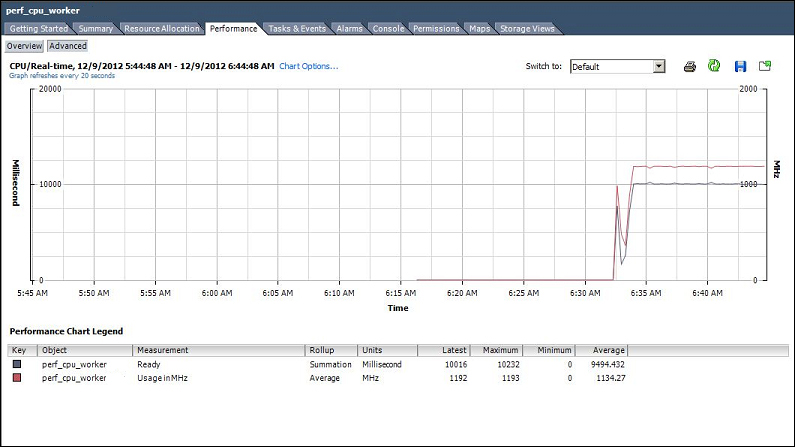
Notice the amount of CPU this virtual machine is demanding and compare that to the amount of CPU usage the virtual machine is actually being able to get (usage in MHz). The virtual machine is demanding more than it is currently being allowed to use.
Notice that the virtual machine is also seeing a large amount of ready time.
Bad performance is when the users are unhappy. But that's subjective and hard to measure. We can measure other metrics easily, but they don't correlate perfectly with whether user's expectations are met. We want to find metrics that correlate well (though never perfectly) with user satisfaction. It's always the case that the final answer to "Is there a performance problem?" is subjective, but we can use objective metrics to make reasonable bets, and decide when it's worth asking the users if they're satisfied with the performance.
A vCPU is in ready state when the vCPU is ready to run (that is, it has a task it wants to execute) but is unable to run because the vSphere scheduler is unable to find physical host CPU resources to run the virtual machine on. One potential reason for elevated ready time is that the virtual machine is constrained by a user-set CPU limit or resource pool limit, reported as max limited (MLMTD). The amount of CPU denied because of a limit is measured as the metric max limited (MLMTD).
Ready time is reported in two different values between resxtop/esxtop and vCenter Server. In resxtop/esxtop, it is reported in an easily-understood percentage format. A figure of 5 percent means that the virtual machine spent 5 percent of its last sample period waiting for available CPU resources (only true for 1-vCPU VMs). In vCenter Server, ready time is reported as a time measurement. For example, in vCenter Server's real-time data, which produces sample values every 20,000 milliseconds, a figure of 1,000 milliseconds is reported for a 5 percent ready time. A figure of 2,000 milliseconds is reported for a 10 percent ready time.
Tip
As you may know that vCenter reports ready time in milliseconds (ms), use the following formula to convert the ms value to a percentage:
                                                 Metric Value (In Millisecond)
Metric Value (In Percent) = ------------------------------------------------	x 100
                                                 Total Time of Sample Period
                            (By default 20000 ms in vCenter for real-time graphs)
Although high ready time typically signifies CPU contention, the condition does not always warrant corrective action. If the value for ready time is close in value to the amount of time used on the CPU, and if the increased ready time occurs with occasional spikes in CPU activity but does not persist for extended periods of time, this might not indicate a performance problem. The brief performance hit is often within the accepted performance variance and does not require any action on the part of the administrator.