

Before you jump onto conclusion as to what to monitor for the CPU performance, you need to make sure that you know what affects the CPU performance. Things that can affect the CPU performance include:
CPU affinity: When you pin down a virtual CPU to a physical CPU, it may happen that your resource gets imbalanced. So, this is not advised until you have a strong reason to do that.
CPU prioritization: When CPU contention happens, the CPU scheduler will be forced to prioritize VMs based on entitlement and queue requests.
SMP VMs: If your application is not multithreaded then there is no benefit adding more CPU resources in VMs. In fact, the extra idle vCPUs add overhead that prevent some more useful work from being done.
Idle VMs: You may have too many idle VMs, which you think should not eat up resources. However, in reality CPU interrupt, shares, reservations, and specially limit settings can still be created for those VMs if they were changed from their default settings.
So, now you know what affects the CPU performance. You can now look at what it takes to monitor the CPU performance.
You can categorize the factors that should be monitored for the CPU performance into three main sections:
Host CPU usage
VM CPU usage
VM CPU ready time
To monitor these sections you need to know the esxtop counters and those are:
PCPU Used (%)
Per group statistics
%Used
%Sys
%RDY
%Wait
%CSTP
%MLMTD
To step through this recipe, you need a running ESXi Server, a couple of running CPU-hungry virtual machines, and a SSH Client (for example, Putty). No other prerequisites are required.
Let's get started:
Log in to the ESXi host using SSH client (Putty).
Run
esxtopand monitor the statistics. The following screenshot is an example output:
Now look at the performance counters as mentioned previously. In the following example output, look at the different metrics.

In the preceding example, you can see our pCPU 0 and pCPU 1 are heavily being used (100 percent and 73 percent UTIL respectively) and it shows the following figure:
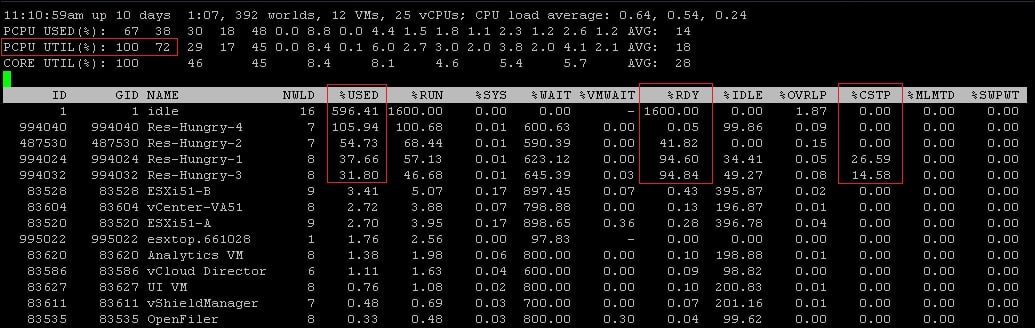
Now in the preceding example, you see that the %Used value for the four CPU-hungry virtual machines are pretty high.
Also look at the %RDY screen, and you will see a high ready time, which indicates a performance problem.
The following list is a quick explanation for each of these metrics:
PCPU USED (%): This is the CPU utilization per physical CPU.
%USED: This is the physical CPU usage by per group.
%SYS: This is the VMkernel system activity time.
%RDY: This is the ready time. This is referred as the amount of time that the group spent ready to run, but waiting for the CPU to be available. Note that this is not adjusted for the number of vCPUs. You should expand the group to see %Ready for each vCPU, or at least divide this by the number of vCPUs to use an average per vCPU.
%WAIT: This is the percentage of time spent in blocked or busy state. This includes idle time and also the time waiting for I/O from the disk or network.
%CSTP: This is referred as the percentage of time spent in the VMkernel, on behalf of the group for processing interrupts. %CSTP for a vCPU is how much time the vCPU spent not running in order to allow the extra vCPUs in the same VM to catch up. High values suggest that this VM has more vCPUs than it needs and the performance might be suffering.
%MLMTD: This is the amount of time spent ready to run, but not scheduled because of a CPU limit.