
Our brains are specially adapted to gather and analyze visual information. Images are easier to understand and recall. We tend to analyze and detect patterns in what we see even when we are not paying attention. The relation between visual perception and cognition can be used to our advantage if we can provide information that we want to communicate in a visual form.
Data visualization is the discipline that studies how to use visual perception to communicate and analyze data. Being a relatively young discipline, there are several working definitions of data visualization. One of the most accepted definitions states:
"Data visualization is the representation and presentation of data that exploits our visual perception in order to amplify cognition."
The preceding quote is taken from Data Visualization: A successful design process, Andy Kirk, Packt Publishing.
There are several variants for this definition, but the essence remains the same—data visualization is a visual representation of data that aims to help us better understand the data and its relevant context. The capacity for visual processing of our brains can also play against us. Data visualization made without proper care can misrepresent the underlying data and fail to communicate the truth, or worse, succeed in communicating lies.
The kind of works that fall under this definition are also diverse; infographics, exploratory tools, and dashboards are data visualization subsets. In the next section, we will describe them and give some notable examples of each one.
There are countless ways to say things, and there are even more ways to communicate using visual means. We can create visualizations for the screen or for printed media, display the data in traditional charts, or try something new. The choice of colors alone can be overwhelming. When creating a project, a great number of decisions have to be made, and the emphasis given by the author to the different aspects of the visualization will have a great impact on the visual output.
Among this diversity, there are some forms that are recognizable. Infographics are usually suited with a great deal of contextual information. Projects more inclined to exploratory data analysis will tend to be more interactive and provide less guidance. Of course, this classification is only to provide reference points; the data visualization landscape is a continuum between infographics, exploratory tools, charts, and data art. Charles Minard's chart, which shows the number of men in Napoleon's 1812 Russian campaign, is shown in the following screenshot:
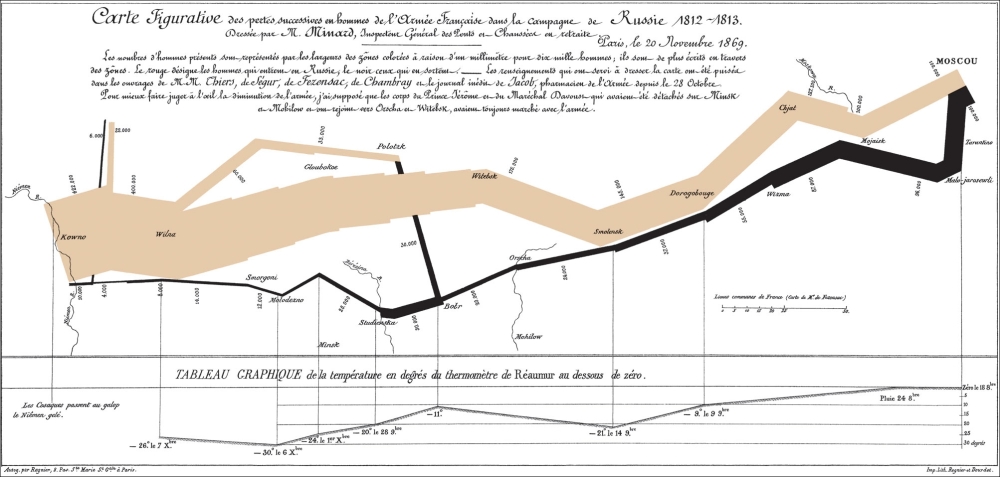
Charles Minard's flow map of Napoleon's march
It would be difficult to classify Charles Minard's figure as an infographic or as a flow chart because it allows for both. The information displayed is primarily quantitative, but it's shown in a map with contextual information that allows us to better understand the decline in the Napoleonic forces. There are several dimensions being displayed at once such as the number of soldiers, the geographic location of the soldiers during the march, and the temperature at each place. The figure does amazing work by showing how diminished the forces were when they arrived at Moscow and how the main enemy was the cold winter.
Infographics is a form of data visualization that is focused on communicating and explaining one or more particular views of a subject. It usually contains images, charts, and annotations, which provides context and enhances the reader's capacity to understand the main display of information. The award-winning infography about the right whale (La ballena Franca in original Spanish), created by Jaime Serra and published in the Argentinian newspaper, Clarin, in 1995 is a great example of how infographics can be a powerful tool to enlighten and communicate a particular subject. This can be found at http://3.bp.blogspot.com/_LCqDL30ndZQ/TBPkvZIQaNI/AAAAAAAAAik/OrjA6TShNsk/s1600/INFO-BALLENA.jpg. A huge painting of the right whale covers most of the infography area. A small map shows where this species can be found during their migratory cycles. There are outlines of the right whale alongside other kinds of whales, comparing their sizes. The image of the whale is surrounded by annotations about their anatomy that explain how they swim and breathe. Bar charts display the dramatic decline in their population and how they are recovering at least in some corners of the globe. All these elements are integrated in a tasteful and beautiful display that accomplishes its purpose, which is to display data to inform the reader. The Right Whale, Jaime Serra, 1995, can be seen in the following image:
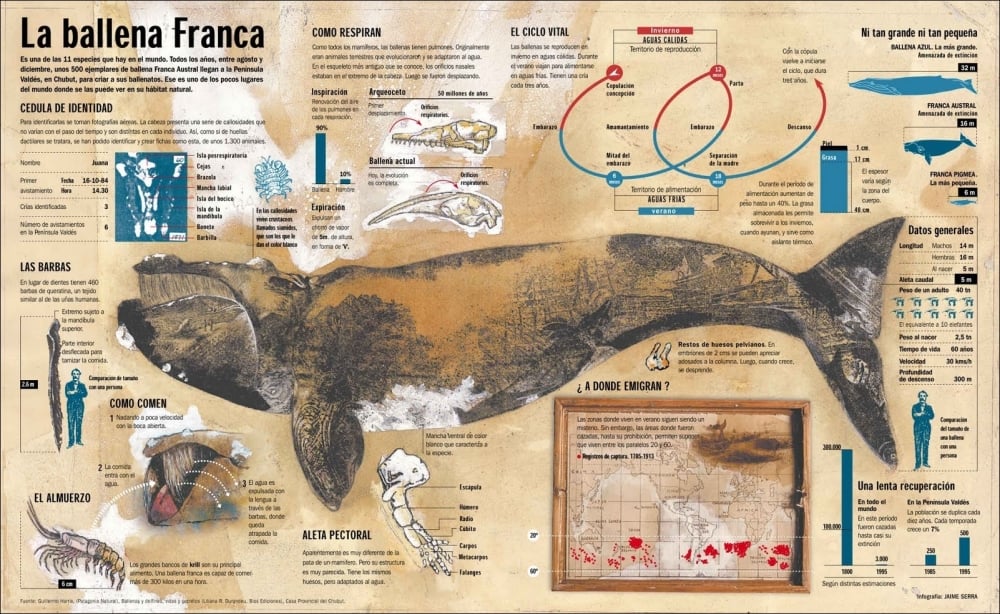
The Right Whale by Jaime Sierra
There are people who don't consider infographics as proper data visualization because they are designed to guide the reader through a story with the main facts already highlighted, as opposed to a chart-based data visualization where the story and the important facts are to be discovered by the reader.
This branch of data visualization is more focused on providing tools to explore and interpret datasets. These visualizations can be static or interactive. The exploration can be either looking at the charts carefully or to interact with the visualization to discover interesting things. In interactive projects, the user is allowed to filter and interact with the visualizations to discover interesting patterns and facts with little or no guidance. This kind of project is usually regarded as being more objective and data centered than other forms.
A great example is The Wealth and Health of Nations, from the Gapminder project (http://www.gapminder.org/world). The Gapminder World tool helps us explore the evolution of life in different parts of the world in the last two centuries. The visualization is mainly composed of a configurable bubble chart. The user can select indicators such as life expectancy, fertility rates, and even consumption of sugar per capita and see how different countries have evolved in regard to these indicators. One of the most interesting setups is to select life expectancy in the y axis, income per person in the x axis, and the size of the bubbles as the size of the population of each country. The bubbles will begin to animate as the years pass, bouncing and making loops as the life expectancy in each country changes. If you explore your own country, you will soon realize that some of the backward movements are related to economic crisis or political problems and how some countries that were formerly similar in their trends in these dimensions diverge. A visualization from Gapminder World, powered by Trendalyzer from www.gapminder.org, is shown in the following screenshot:
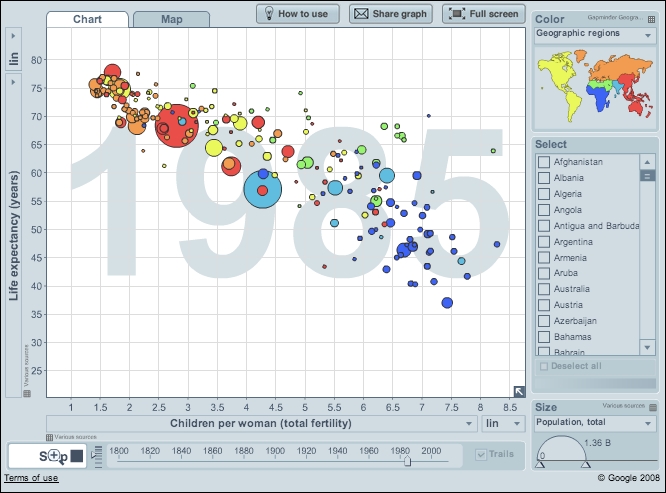
The time series for dozens of variables allow the user to explore this dataset, uncover stories, and learn very quickly about how countries that are similar in some regards can be very different in other aspects. The aim of the Gapminder project is to help users and policy makers to have a fact-based view of the world, and the visualization certainly succeeds in providing the means to better understand the world.
Dashboards are dense displays of charts that help us to understand the key metrics of an issue as quickly and effectively as possible. Business intelligence dashboards and website users' behavior are usually displayed as dashboards. Stephen Few defines an information dashboard as follows:
"A visual display of the most important information needed to achieve one or more objectives; consolidated and arranged on a single screen so the information can be monitored at a glance."
The preceding quote can be found in Information Dashboard Design: The Effective Visual Communication of Data, Stephen Few, O'Reilly Media.
As the information has to be delivered quickly, there is no time to read long annotations or to click controls; the information should be visible, ready to be consumed. Dashboards are usually bundled with complementary information systems to further investigate issues if they are detected. The distribution of the space in a dashboard is the main challenge when designing them. Compact charts will be preferred in this kind of project, as long as they still allow for speedy decoding of the information. We will learn about designing dashboards in Chapter 9, Creating a Dashboard. An example dashboard from Chapter 9, Creating a Dashboard, showing the performance of students in a class can be seen in the following screenshot:

This classification mentions only some of the forms of data visualization projects; most parts of data visualizations won't fit exactly under these labels. There is plenty of room to experiment with new formats and borrow elements of infographics, dashboards, and traditional charts to communicate more effectively.
Despite being a young discipline, there are great books on data visualization and information design. A successful data visualization practitioner should also know about design, statistics, cognition, and visual perception, but reading data visualization books is a good start.
Edward Tufte is an expert in information design and his works are a must-read in this field. They are filled with good and bad examples of information design and comments about how to better communicate quantitative information. They contain collections of images from ancient charts and visualizations, which explain their historic context and the impact they had. The discussion is not restricted to how to communicate quantitative information; there are examples ranging from natural history to architecture:
Visual Explanations: Images and Quantities, Evidence and Narrative, Edward R. Tufte, Graphics Press
The Visual Display of Quantitative Information, Edward R. Tufte, Graphics Press
Beautiful Evidence, Edward R. Tufte, Graphics Press
Envisioning Information, Edward R. Tufte, Graphics Press
Stephen Few is a data visualization consultant who specializes in how to display and communicate quantitative information, especially in business environments. His books focus on dashboard and quantitative information and provide actionable guidelines on how to effectively communicate data:
Information Dashboard Design: The Effective Visual Communication of Data, Stephen Few, O'Reilly Series
Now You See It: Simple Visualization Techniques for Quantitative Analysis, Stephen Few, Analytics Press
Alberto Cairo teaches visualization at the University of Miami. He has extensive experience in data journalism and infographics. His most recent book focuses on data visualization and how good infographics are made. He also has a strong presence on social media; be sure to follow him at http://twitter.com/albertocairo to be informed about infographics and data visualization:
The Functional Art: An introduction to information graphics and visualization, Alberto Cairo, New Riders
Andy Kirk is a data visualization consultant and author. He recently published a book sharing his experiences in creating data visualizations. He gives guidelines to plan and make the creation of visualizations more systematic. The book is filled with actionable advice about how to design and plan our visualization projects. Andy's blog (http://www.visualisingdata.com) is a great source to be informed about the latest developments in the field:
Data Visualization: A Successful Design Process, Andy Kirk, Packt Publishing
There isn't a universal recipe to create good data visualizations, but the experience and guidelines from experts in the field can help us to avoid mistakes and create better visualizations. It will take time to have the necessary skills to create great data visualizations, but learning from experienced people will help us make a safer journey. As with many other things in life, the key to learning is to practice, get feedback, and improve over time.