-
Book Overview & Buying
-
Table Of Contents

HTML5 Data and Services Cookbook
HTML5 Data and Services Cookbook
Overview of this book
HTML5 is everywhere. From PCs to tablets to smartphones and even TVs, the web is the most ubiquitous application platform and information medium bar. Its becoming a first class citizen in established operating systems such as Microsoft Windows 8 as well as the primary platform of new operating systems such as Google Chrome OS.
"HTML5 Data and Services Cookbook" contains over 100 recipes explaining how to utilize modern features and techniques when building websites or web applications. This book will help you to explore the full power of HTML5 - from number rounding to advanced graphics to real-time data binding.
"HTML5 Data and Services Cookbook" starts with the display of text and related data. Then you will be guided through graphs and animated visualizations followed by input and input controls.
Data serialization, validation and communication with the server as well as modern frameworks with advanced features like automatic data binding and server communication will also be covered in detail.This book covers a fast track into new libraries and features that are part of HTML5!
Table of Contents (21 chapters)
HTML5 Data and Services Cookbook

Credits
About the Authors
About the Reviewers
www.PacktPub.com
Preface
 Free Chapter
Display of Textual Data
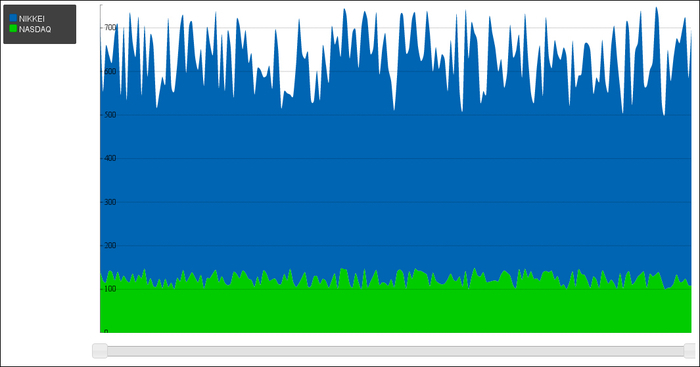
Display of Graphical Data
Animated Data Display
Using HTML5 Input Components
Custom Input Components
Data Validation
Data Serialization
Communicating with Servers
Client-side Templates
Data Binding Frameworks
Data Storage
Multimedia
Installing Node.js and Using npm
Community and Resources
Index