

Let's start from the beginning. In the following chapters, we will discuss computer graphics and visualizations for the Web. Therefore, it's important to understand the basic terminology of this domain. In this section, I will refresh your knowledge of the two most common image representations (vector and pixel graphics). I will also discuss the web standards that are relevant for graphical applications (DOM, SVG, and so on). If these definitions are not new for you, then nothing can stop you from jumping directly to the next section.
The
Document Object Model (DOM) is the tree representation of the hierarchical elements of an HTML document and it was specified by the
World Wide Web Consortium (W3C). These elements in the DOM are called
nodes (for example, html, head, body, and so on), which can have attributes (for example, class="header") and
content (for example, "My Application" is the content of the h1 node). The DOM provides a public JavaScript interface with which we can access nodes and manipulate them.
Let's look at the source code of a simple HTML page to see an example of the DOM tree:
<html>
  <head>
    <title>My App</title>
  </head>
  <body>
    <h1 class="header>My Application</h1>
    <p class="content">
      Lorem ipsum dolor sit amet, ...
    </p>
  </body>
</html>
Tip
Downloading the example code
You can download the example code files for all Packt books you have purchased from your account at http://www.packtpub.com. If you purchased this book elsewhere, you can visit http://www.packtpub.com/support and register to have the files e-mailed directly to you.
Developers often visualize the DOM tree and its hierarchical elements by indenting the HTML code properly. The DOM tree of the previous example can also be displayed and modified with the developer tools of a modern browser. See the following screenshot:
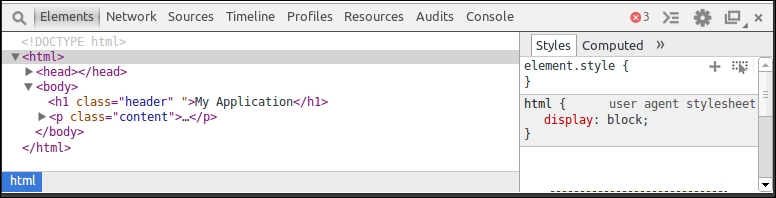
DOM tree in Chrome developer tools
A vector graphic is an image represented solely by the geometric primitives (shape) and attributes (size, margins, appearance, and so on) of its containing elements. These elements can be primitive shapes (such as lines, circles, triangles, and so on) or complex shapes that are composed by these primitives. All elements are included in the graphic; therefore, the whole graphic can be described by implicit mathematical expressions. Thus, the size of a vector graphic is only dependent on the number and complexity of the elements in the image and not on the resolution in which it will be displayed.
Note
Rule of thumb for vector graphics
The more the elements in the image, the higher the cost to draw or update the graphic, but in general, the costs do not depend on the resolution of the generated image (lossless rescaling).
Let's look at a simple example. An image of a circle can be fully described by the shape of a circle with the coordinates of its center point and radius. In all modern browsers, we can generate a vector graphic by embedding Scalable Vector Graphics (SVG), a web standard for vector graphics specified by the W3C directly in the DOM, as follows:
<html>
  ...
  <body>
    <svg id="vis" width="640" height="480">
      <circle cx="25" cy="25" r="20" style="fill:red;">
    </svg>
  </body>
</html>
All containing elements of a vector graphic are usually stored in a scene graph, a tree representation of the hierarchical elements of the graphic. This concept is very similar to the DOM tree, and in the case of SVG, the scene graph is directly embedded in the DOM tree. We can see this in the previous example (by looking at the svg node) that contains the circle element.
As we mentioned previously, we can also use JavaScript to generate or modify SVGs. Let's use the partially complete helper function that generates and draws SVG nodes. Don't worry about the details of this function; just imagine that it will create a vector graphic element (you can look it up in the source code of this chapter if you are brave enough):
<script type="text/javascript">
function VectorGraphic(parent, tag, attrs) {

  var el = document.createElementNS('http://www.w3.org/2000/svg', tag);

  ...
  return {
    on: function(event, handler){...},
    fill: function(color){...},
    stroke: function(color){...},
    draw: function() {
      parent.appendChild(el);
    }
  }
}
</script>
The preceding function creates a new SVG node and returns a .draw() method. It appends this new element to the parent container. Additionally, it provides methods to style the layout of the new element. Let's use this function to create the same circle from the previous example from within JavaScript:
<script type="text/javascript">
  var ctx = document.getElementById('vis');

  var circle = VectorGraphic(ctx, 'circle', {cx:25, cy:25, r:20});

  circle.fill('red');

  circle.draw();
</script>
The preceding code will generate the same circle as before with the center point at the coordinates 25, 25 and a radius of 20. The following figure shows the result of the graphic in the browser, where the left-hand side shows the original image and the right-hand side shows the image after zooming in:
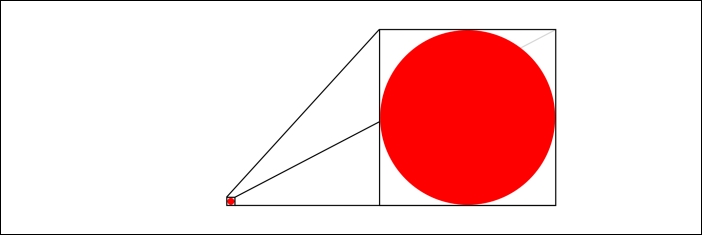
A vector graphic generated in the SVG node (left: normal, right: zoom)
We observe that the circle will always appear in the best resolution no matter how far we zoom into the image. The reason for this is that the vector graphics are recomputed (by the mathematical expressions), redrawn, and rasterized according to the relevant display and zoom factor.
We silently skipped another very important fact of SVGs such that all the elements of the graphic appear in the DOM tree of the SVG node. In our case, we can see in the previous example of the HTML page that the SVG node contains a circle element. This means that the browser also knows about all the elements in the image. Therefore, we can use all built-in capabilities to style and observe these elements. For example, it's possible to attach an event listener with JavaScript to the circle and call event handlers when the user interacts with this element of the graphic. This event handler could look like this:
<script type="text/javascript">
  var ctx = document.getElementById('vis');
  var circle = VectorGraphic(ctx, 'circle', {cx:25, cy:25, r:20});
  circle.fill('red');
  circle.on('mouseover', function() {
    this.stroke('blue');
  });
  circle.draw();
</script>
Vector graphics (particularly generated with SVG) are used in the Web, in general, to draw graphics that contain a moderate number of elements and when interactions and controls (such as zooming, panning, selecting elements, and so on) are desired. Graphics for high performance with a big number of elements would rather use pixel graphics.
A pixel graphic (often called as a raster graphic) is an image that is represented solely by the pixels in the graphic. Thus, its size is only dependent on the resolution of the image.
Note
Rule of thumb for pixel graphics
The more the pixels in the image (the higher the resolution of the image), the higher the cost to draw or update the graphic, but in general, the cost does not depend on the number of elements in the generated image.
In general, pixel graphics are rasterized images of a geometric representation. Therefore, an image of a circle can be just as well defined by the shape of a circle with coordinates of its center point and a radius. The description of the circle is exactly the same as for vector graphics, only the ways of storing and displaying the image are different.
Let's write a partially complete JavaScript helper function to generate pixel graphics with the Canvas API. Don't worry about the details of this function; just imagine that it will create a pixel graphic element (you can look it up in the source code of this chapter if you are brave enough):
<script type="text/javascript">
function PixelGraphic(parent, tag, attrs) {

  var el = parent.getContext('2d');
  el.beginPath();
  ...
  return {
    stroke: function (color){... },
    fill: function (color){ ... },
    draw: function () {
      el.arc(attrs.cx, attrs.cy, attrs.r, 0, 2*Math.PI);
      ...
    }
  }
}
</script>
If we generate such a circle with JavaScript, the resulting code looks very similar to the previous vector graphic example:
<script type="text/javascript">
  var ctx = document.getElementById('vis');
  var circle = PixelGraphic(ctx, 'circle', {cx:25, cy:25, r:20});
  circle.fill('red');
  circle.draw();
</script>
The preceding code generates a very similar circle element with the center point at the coordinates 25, 25 and a radius of 20. However, if we look at the resulting DOM tree, we observe a small but important difference, that is, the circle element is not visible in the canvas node. Let's look at the HTML code of this example:
<html>
  ...
  <body>
    <canvas id="vis" width="640" height="480"></canvas>
  </body>
</html>
The pixel graphic in the previous example is now stored in the canvas element. As a result, the image is rasterized and transformed to a pixel array of color values. Therefore, the canvas element does not contain any information about the elements of the image.
If we look at the result of this code in the browser, we see the exact same image as before with the vector circle. The only small, but very important difference will become visible once we zoom inside the graphic. We will soon start to see pixels instead of a sharp and smooth circle. This effect is visualized in the following figure:
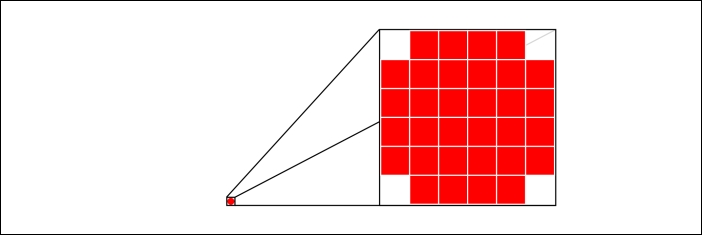
A pixel graphic generated in canvas (left: normal, right: zoom)
This effect can be easily explained if we look closer at how pixel graphics are stored. First, the image is internally drawn on a container with the defined dimension of the image. Then, the image is divided by a raster, which is defined by the image resolution. Finally, the image is stored as pixel values of this raster. If we see a pixelated image, we see exactly these discrete rastered pixel values. The whole process is called rasterization and is visualized in the following figure:
A pixel graphic generated and rasterized in Canvas
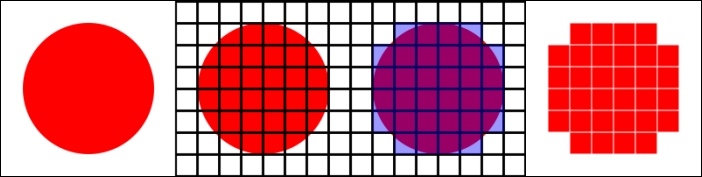
Besides lossy rescaling, we can spot another big difference to vector graphics: the browser does not know about the elements in the image. Therefore, it's not possible to see and address the elements of the graphics in the DOM tree anymore. It's not possible anymore to attach an event listener to the circle and call event handlers when the user interacts with an element of the graphic. In pixel graphics, we are primarily interacting with pixel values instead of objects, as we can see in the following figure:
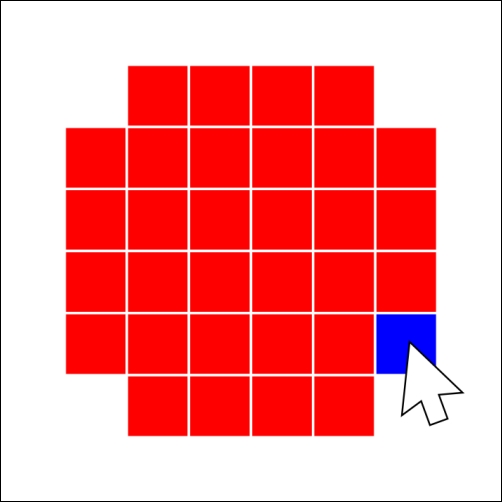
Interaction with the generated pixel graphic
We usually prefer pixel graphics in the browser—particularly generated with Canvas (2D) or WebGL (3D)—for graphics that contain a big number of elements and performance (high frame rate) is more important than the image quality, interactions, and zooming.