

We will very soon encounter a problem that some differences between two neighboring data points are very small and hard to grasp. In this case, it will be very handy to just zoom in to this particular position.
Let's start with a simple example of a zoom where we just want to enlarge the viewpoint of the svg image. The following figure illustrates the problem:
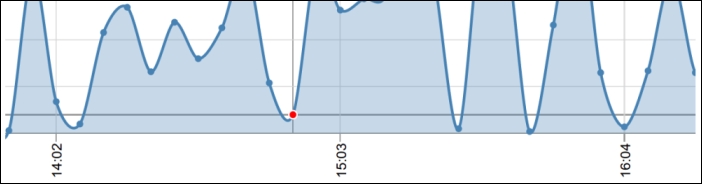
Zoomed viewpoint of the chart
To implement this zoom, we need to add another group layer to the svg element, which contains all the previous underlying layers and handles zooming and panning properly via the translate and scale transformation attributes so that we don't have to touch other components.
Then, zooming can be implemented with the d3.behavior.zoom() function, a helper method that can automatically handle zooming and panning events for mouse and touch inputs. If the event is triggered, d3.event provides the current scale and translation values to zoom and pan. Let's add this behavior to the area...