Book Image

Learning D3.js 5 Mapping - Second Edition

By : Thomas Newton, Oscar Villarreal, Lars Verspohl
Book Image

Learning D3.js 5 Mapping - Second Edition

By: Thomas Newton, Oscar Villarreal, Lars Verspohl

Overview of this book

D3.js is a visualization library used for the creation and control of dynamic and interactive graphical forms. It is a library used to manipulate HTML and SVG documents as well as the Canvas element based on data. Using D3.js, developers can create interactive maps for the web, that look and feel beautiful. This book will show you how build and design maps with D3.js and gives you great insight into projections, colors, and the most appropriate types of map. The book begins by helping you set up all the tools necessary to build visualizations and maps. Then it covers obtaining geographic data, modifying it to your specific needs, visualizing it with augmented data using D3.js. It will further show you how to draw and map with the Canvas API and how to publish your visualization. By the end of this book, you'll be creating maps like the election maps and the kind of infographics you'll find on sites like the New York Times.
Table of Contents (13 chapters)
6
Finding and Working with Geographic Data

Polygon

To create a polygon, use the polygon tag. The best way to think about an SVG polygon is to compare it to a child's dot-to-dot game. You can imagine a series of dots and a pen connecting each (x, y) coordinate with a straight line. The series of dots is identified in the points attribute. Take the following as an example (http://localhost:8080/chapter-2/polygon.html):

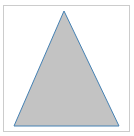
<polygon points="60,5 10,120 115,120"/> 

First, we start at 60,5 and we move to 10,120. Then, we proceed to 115,120 and, finally, return to 60,5.

The pen returns to the starting position automatically.