Book Image

Google Visualization API Essentials

By : Traci Lynn Ruthkoski
Book Image

Google Visualization API Essentials

By: Traci Lynn Ruthkoski

Overview of this book

There's a lot of data in our world, and visual representations are often the best method of making sense of it all. Yet, it should not take an army of programmers and analysts to create visualizations in order to make data useful. The Google Visualization API is accessible to novice and advanced programmers alike, making data useful to more people."Google Visualization API Essentials" will show you how to create interactive data displays with very little code. The API, combined with Google Spreadsheets and Fusion Tables, is a complete system, from data management to analytical displays. Not only is it simple to learn, but the Google Visualization API can also be viewed as a first step to learning additional Google APIs."Google Visualization API Essentials" uses both methodology overviews and hands-on examples with real data to introduce chart and graph creation on the Google platform. Topics are presented from various aspects, including Google Spreadsheets and Fusion Tables, and Graphic User Interfaces. An overview of the various API development environments available to developers is also covered. Basic and advanced charts, data source connectivity, style formatting, and publishing options are also explored in depth."Google Visualization API Essentials" brings the arsenal of Google Visualizations into the web developer toolkit.
Table of Contents (16 chapters)

Chart editor for users


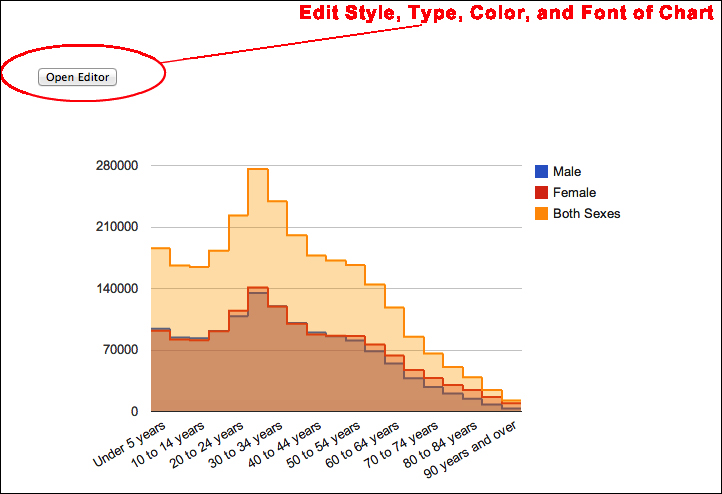
The chart editor, as seen in Spreadsheet visualizations, can become part of a coded visualization. With the chart editor option, users can set their own style and chart type preferences. The editor is the same editor used by Spreadsheets and Fusion Tables. To make chart editor an option, a button to open the editor must be created in the standard HTML form method.

    <input type='button' onclick='openEditor()' value='Open Editor'> 

The remaining methods to implement the editor are primarily the same as with other button-controlled charts.

However, one small programming requirement in addition to the editor-specific button itself, is to include the chartedit library package to be loaded by google.load.

google.load('visualization', '1', {packages:['charteditor']});

To create the chart itself, the ChartWrapper class is used. Finally, to alert the application when the editor button has been pushed, an event listener is used. The creation of the listener is in the same...