

In this recipe, we will learn about remote debugging PhantomJS scripts using the remote-debugger-port and remote-debugger-autorun command-line arguments.
To run this recipe, we will need the following:
PhantomJS installed on our
PATHA script to run with PhantomJS, which we are interested in debugging
Our computer's IP address
An open port over which the debugger will communicate
Another browser such as Google Chrome or Safari
The script in this recipe is available in the downloadable code repository as recipe08.js under chapter01. If we run the provided example script, we must change to the root directory of the book's sample code.
The script in this recipe runs against the demo site that is included with the cookbook's sample code repository. To run that demo site, we must have Node.js installed. In a separate terminal, change to the phantomjs-sandbox directory and start the app with the following command:
node app.js
Given the following script:
var page = require('webpage').create();

page.onResourceReceived = function(res) {
  if (res.stage === 'end') {
    console.log(JSON.stringify(res, undefined, 2));
  }
};

page.open('http://localhost:3000/cache-demo', function(status) {
  if (status === 'success') {
    console.log('All done.');
    phantom.exit();
  } else {
    console.error('Could not open page! (Is it running?)');
    phantom.exit(1);
  }
});
Enter the following at the command line:
phantomjs --remote-debugger-port=9000 --remote-debugger-autorun=true chapter01/recipe08.js
Note that with the remote-debugger-autorun argument set to true, the script will run immediately as it normally would, but it will also ignore calls to phantom.exit and suspend execution, printing out the following message:
Phantom::exit() called but not quitting in debug mode.
Tip
If we want more control over when the script begins (for example, we want to set breakpoints first), then simply omit the remote-debugger-autorun argument. By omitting that argument, PhantomJS will start and will load the script, but will not execute it until you issue the __run() command in the debugger.
Now we can open our other browser (for example, Chrome) and enter our IP address and the port that we specified with remote-debugger-port. For example, if our computer's IP address is 10.0.1.8, we would enter http://10.0.1.8:9000/ into the location bar. Then, we should see something like the following screenshot:
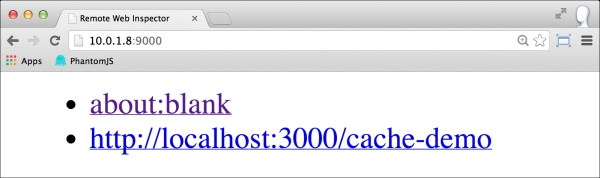
The viewport will contain the PhantomJS browsing session's history as a list. As we are interested in accessing the debugger tools, we will click on the link that reads about:blank. This will take us to /webkit/inspector/inspector.html, and it should look something like the following screenshot:
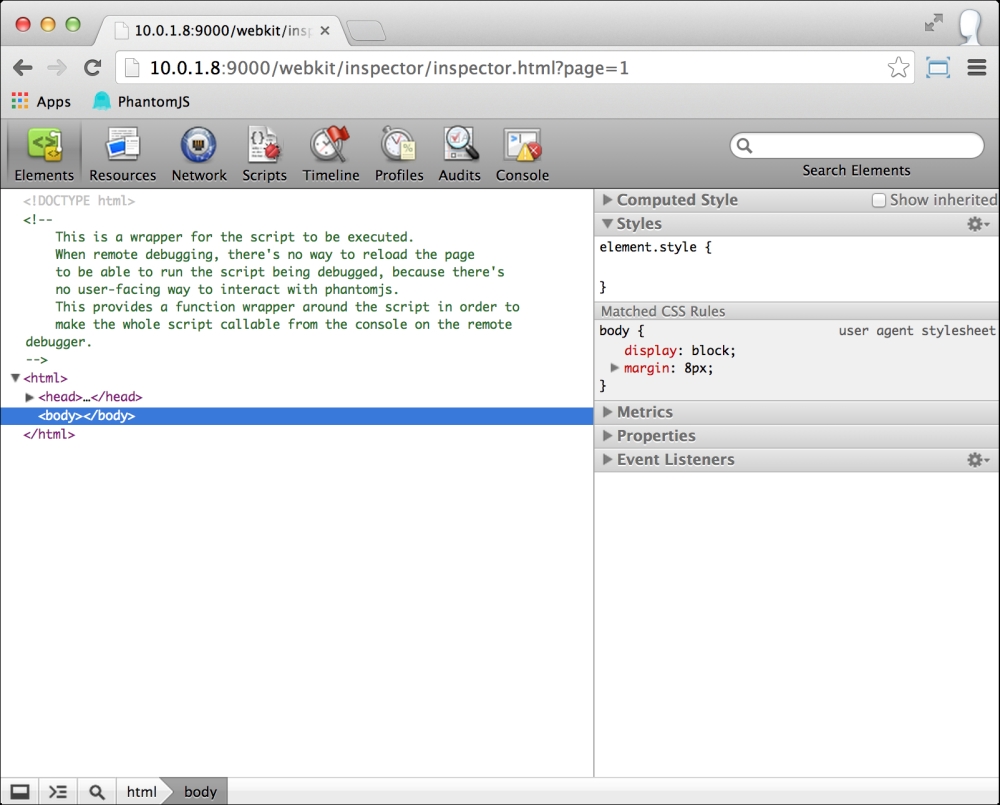
If we have worked in the Chrome or Safari developer tools before, the toolbar should be familiar. While debugging PhantomJS scripts, we will be particularly interested in the Scripts and Console tabs.
Tip
For those unfamiliar with the WebKit Web Inspector, check out Majd Taby's thorough introduction, "The WebKit Inspector", at http://jtaby.com/blog/2012/04/23/modern-web-development-part-1.
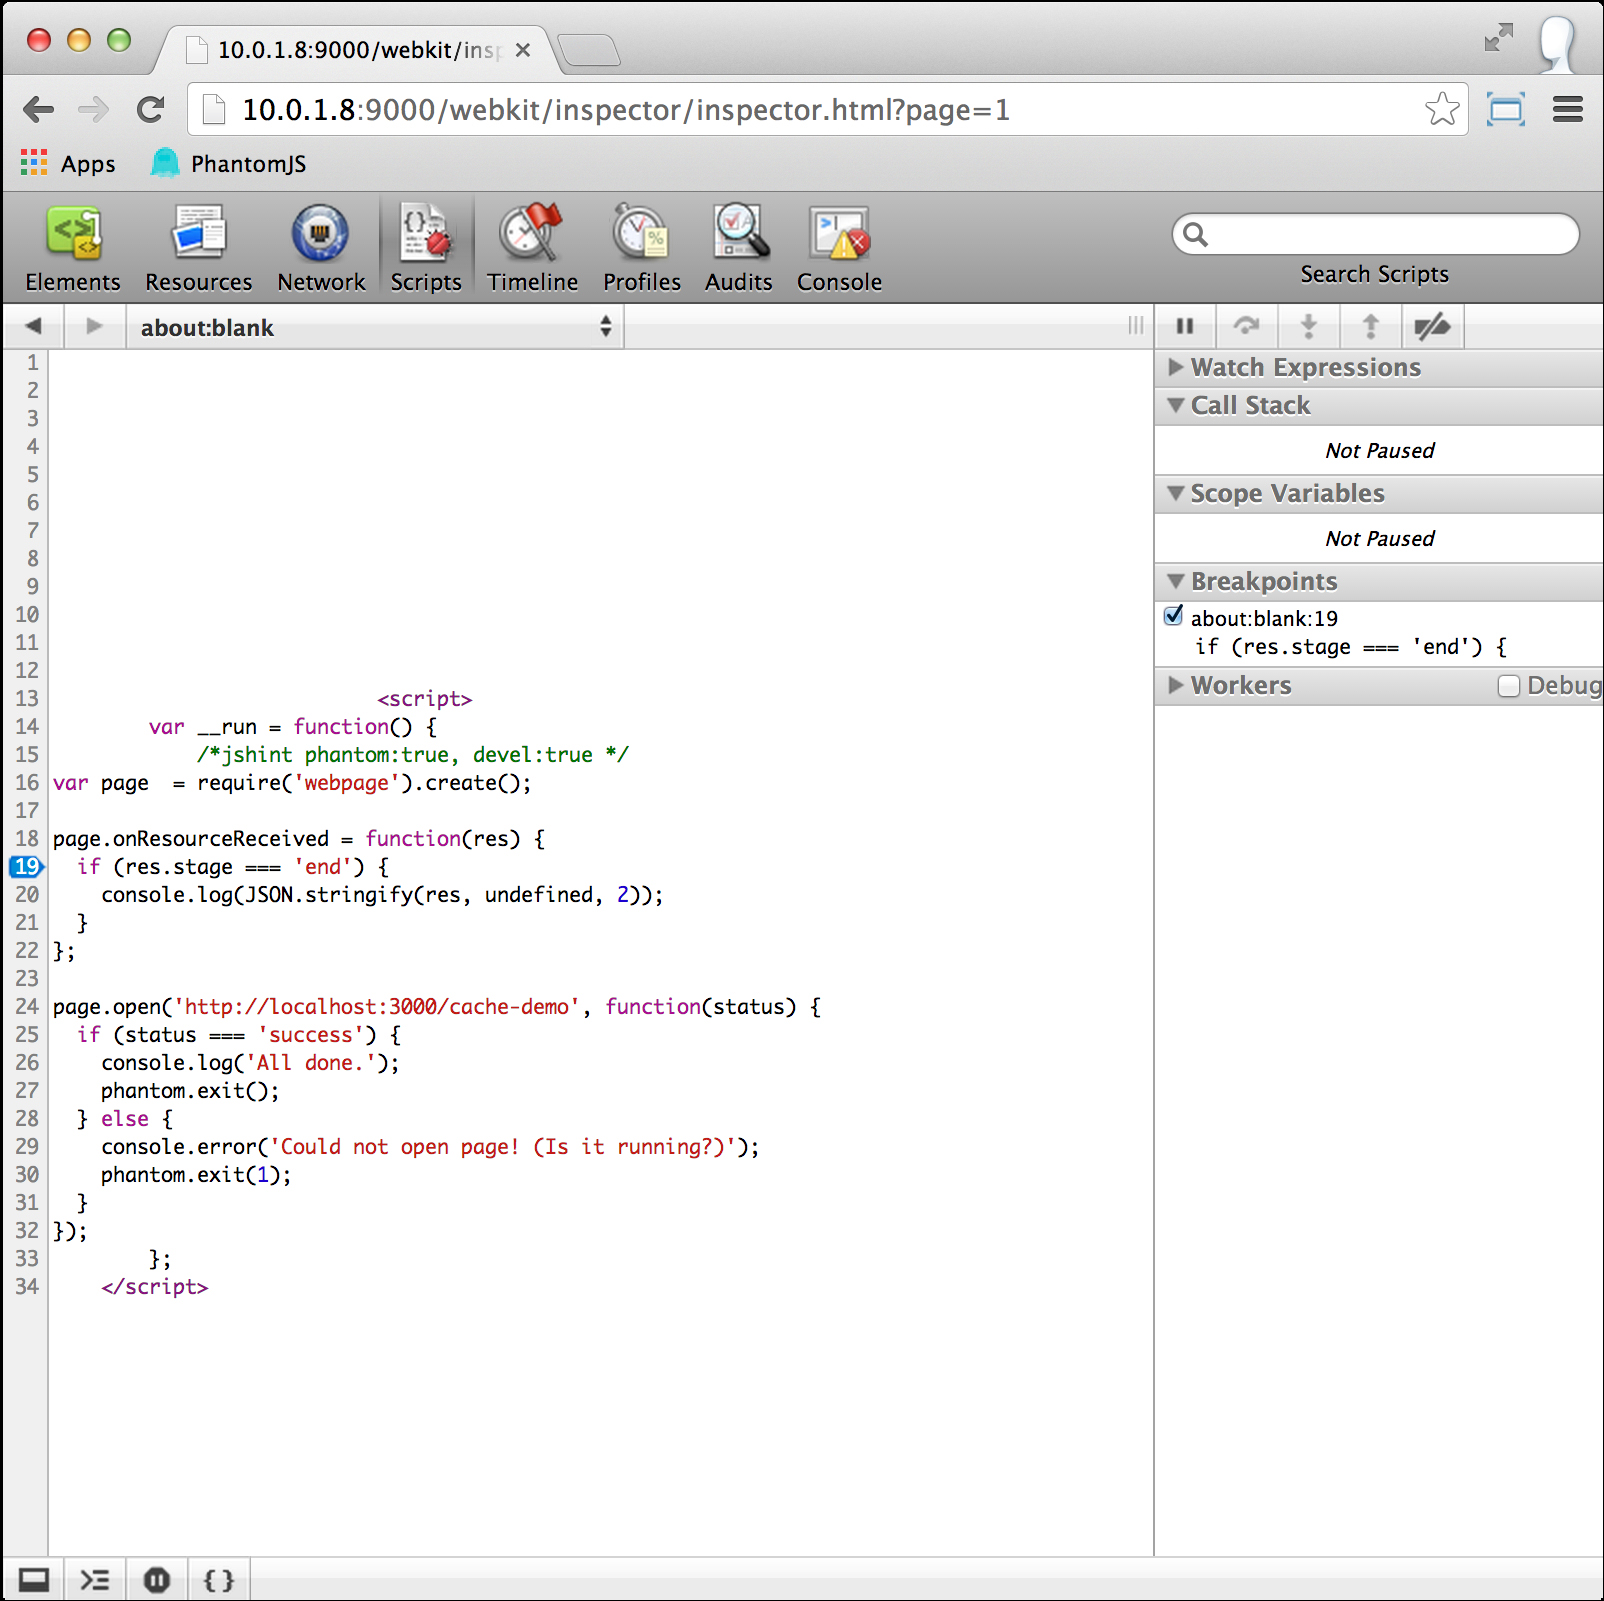
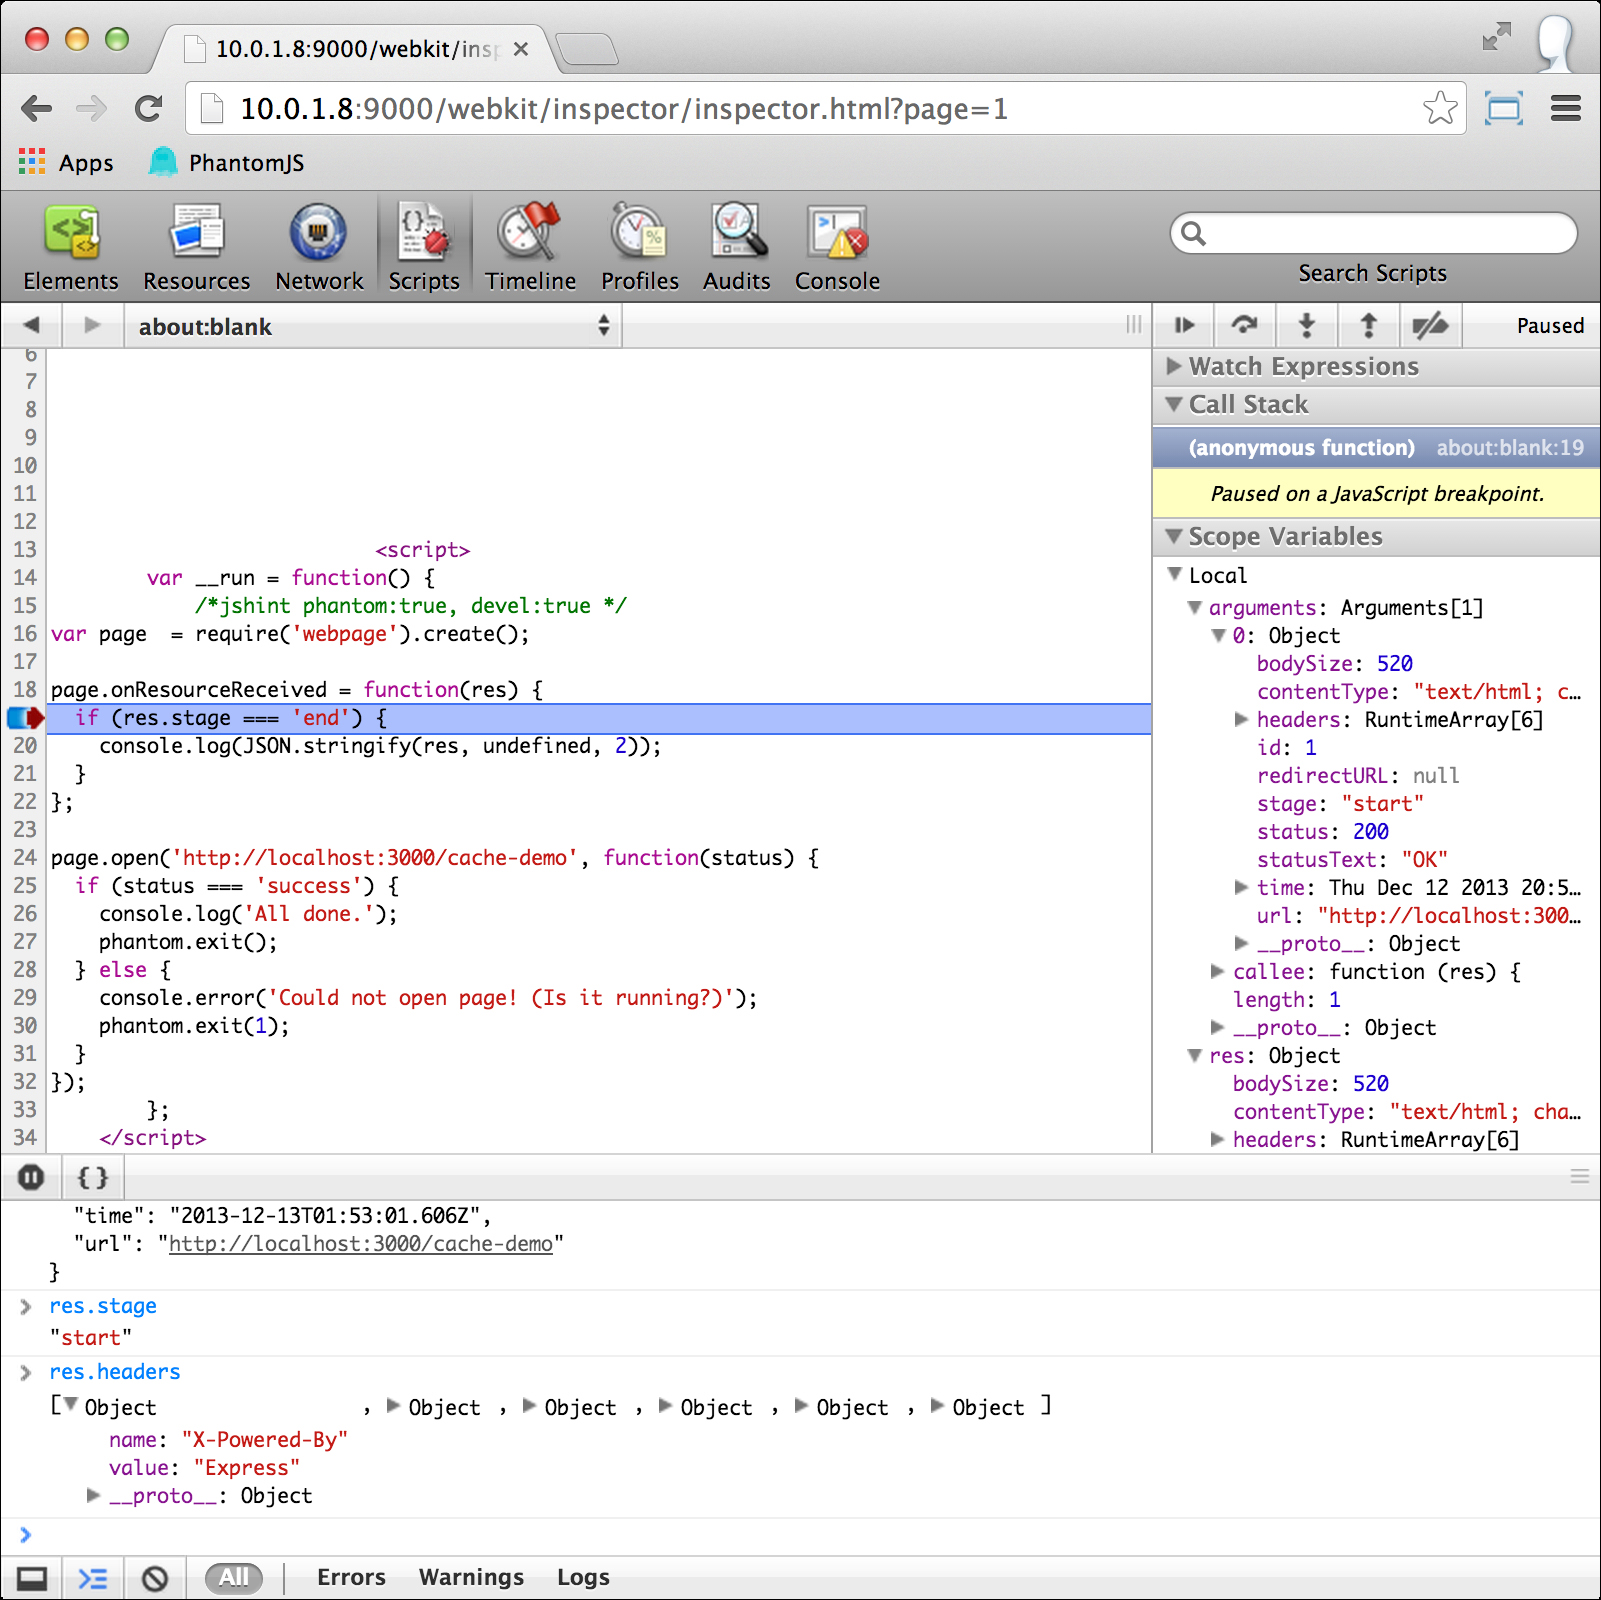
Once we have the debugger open, click on the Scripts tab. In the Scripts tab, click on the drop-down menu (in the top toolbar, just below the tabs) and select about:blank. This will show us our script as seen in the following screenshot. Click on any line number in the left-side gutter to set a breakpoint.
With our breakpoint set, click on the Console tab to toggle into the console. Since we used the remote-debugger-autorun argument, we will see our console.log and other such statements printed to the console from our first (automatic) run. Note the blue prompt at the bottom of the console as seen in the following screenshot; we can enter new expressions to be evaluated here at this prompt. To run our PhantomJS script again, we enter __run().
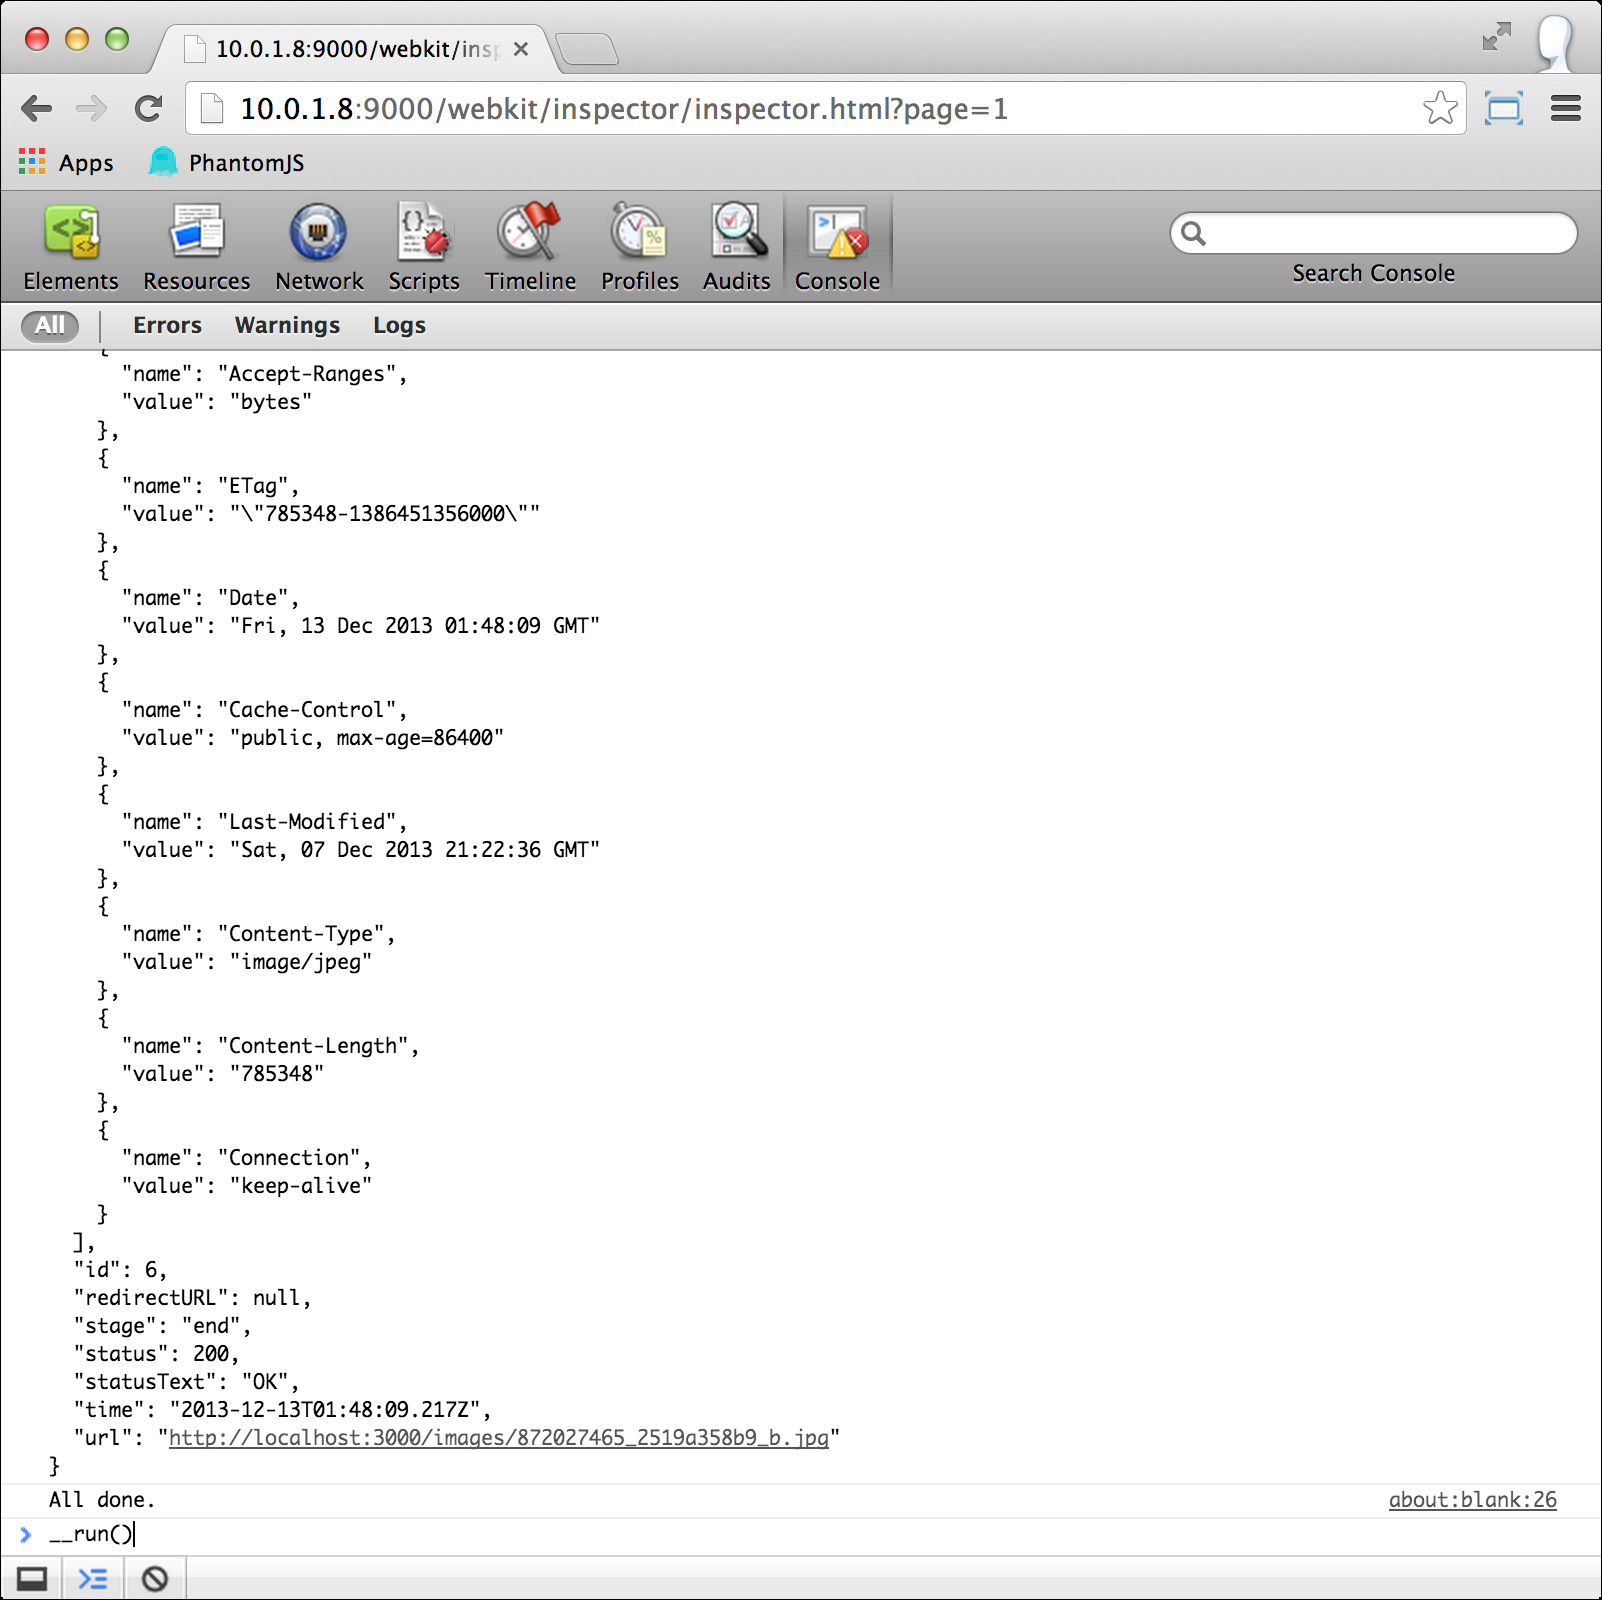
Entering __run() in the console will execute the script again. The script execution will pause on any breakpoints that we set and we will automatically be brought into the Scripts tab. In the Scripts tab, we can inspect our call stack, inspect local variables and objects at runtime, manipulate the runtime environment through the console, and more.
When we are done debugging our script, we can simply close the browser and then use Ctrl + C to quit the PhantomJS process in the terminal.
Our preceding example script is a simple one. We proceed in the following manner:
We create a
webpageobject.We assign an event handler function to the
webpageobject'sonResourceReceivedcallback. This callback will print out each resource received usingJSON.stringify.Lastly, we open the target URL (
http://localhost:3000/cache-demo) usingwebpage.open, callingphantom.exitin the callback.
Effective debugging is an essential skill for every developer, and it is fantastic that PhantomJS has the WebKit remote debugging built-in as a first-class tool. While the debugger itself may be overkill for simple situations, sometimes console.log just isn't a powerful enough (or fast enough) tool. In those cases, it is comforting to know that you have these debug tools at your disposal.
One important thing to note about using the remote debugger with PhantomJS is that we will need to be aware of what context we are attempting to debug. Are we debugging the PhantomJS script itself? Or a script on the page that the PhantomJS script is accessing? Or some interaction between them? In the simple case (as previously demonstrated), the remote debug mode makes it almost trivial to inspect our PhantomJS script's execution at runtime. However, it does take some extra work if we need to also debug a script on the page that PhantomJS is accessing. In those cases, we may find it useful to use the remote-debugger-autorun argument; this will pre-populate the debugger's landing page with links to the inspector for the PhantomJS script's context and also the accessed web page's context. We can open these links each in a new tab, giving a separate debugger session for each context we need to work in.
Of the two debugger-related command-line arguments, remote-debugger-port is the essential one. The remote-debugger-port argument serves two functions. The first, implicit function is to put PhantomJS into the debug harness. Its second, explicit function is to set the port that PhantomJS will use for the WebKit remote debugging protocol.
Having these remote debugging capabilities in PhantomJS is extremely handy if we need to inspect or otherwise troubleshoot some misbehaving or unpredictable code. But something else that is nice about how the debugging toolkit is implemented is that we don't need anything else except another browser with a GUI. We do not need to install any special extensions in Chrome or Safari for the debugger to work. All we need to do is specify the port on the command line and point the browser at our computer's IP and voila—the full power of a GUI debugger for our otherwise headless web browser.
Tip
Although we can use any browser as the target viewport for the remote debugger, our best results will be in Safari or Chrome. Safari is currently the dominant WebKit-based browser; Chrome uses the Blink rendering engine, but retains many of the features from its WebKit heritage. The remote debugger will function in other browsers (for example, Firefox or Opera) but certain things may not render properly, making it much more difficult to use.
The remote-debugger-autorun command-line argument is optional and if specified as true, the script passed to PhantomJS will be run immediately in the debug harness. While this may be a convenient feature, it is seldom what we want.
Under normal debugging, we would already have some idea of where our code is defective (for example, from the errors or stack traces that we already have). With that knowledge, we would want to start our PhantomJS script in the debug harness, then navigate to the Scripts tab and set our breakpoints, and then execute the script.
If we have not set the script to run automatically, then how do we execute it? If we look again at our script as it appears in the about:blank selection under the Scripts tab, we will notice that it has been wrapped in a function and assigned to the variable named __run. To execute our script, we enter __run() into the debugger console and hit enter to call the function.