

In this recipe, we will examine how to debug your app in the Chrome browser.
From the menu in the upper right-hand corner, select Tools and then Developer Tools.
Verify via Settings (which is the wheel icon in the upper right corner of the Developer Tools section) that the Enable JavaScript source maps option is turned on. Make sure that debugging is enabled, either on all the exceptions or only on uncaught exceptions.
Choose Sources in the Developer Tools menu, then press Ctrl + O to open a file browser and select the Dart script you wish to debug.
Now reload the application and you will see that the execution stops at the breakpoint. On the right, you have a debug menu, which allows you to inspect scope variables, watch the call stack, and even create watch expressions, as shown in the following screenshot:

Debugging JS in Chrome
Chrome uses the source map file <file>.js.map generated while compiling the JavaScript code to map the Dart code to the JavaScript code in order to be able to debug it.
In this recipe, we will examine how to debug your app in the Firefox browser.
In Firefox, the source maps feature is not yet implemented. Use Shift + F2 to get the developer toolbar and the command line. In the top menu, you will see Debugger. Place a breakpoint and reload the file. Code execution then stops and you can inspect the value of the variables, as shown in the following screenshot:
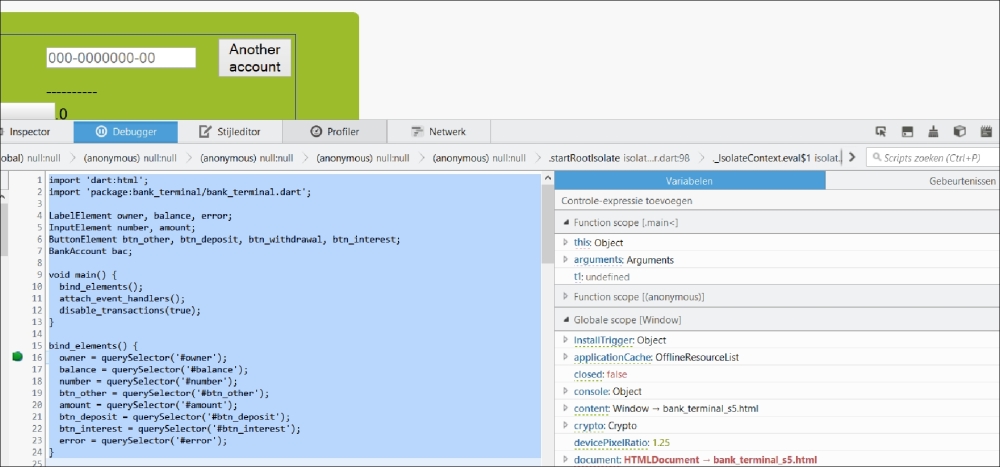
Debugging JS in Firefox