

In the previous section, we saw that D3.js can handle all the filtering action with solely modifying the domain and range attributes of the axis object. Filtering and selecting data is a common task in data visualization; therefore, D3.js implements a much more advanced filtering method called brushes.
A brush is a D3.js module initialized with an x and/or a y axis scale and automatically creates a draggable and resizeable box on top of a visualization container. While dragging and resizing this box, the brush automatically adapts the range and domain of the axis scales. A brush often looks similar to the following image:
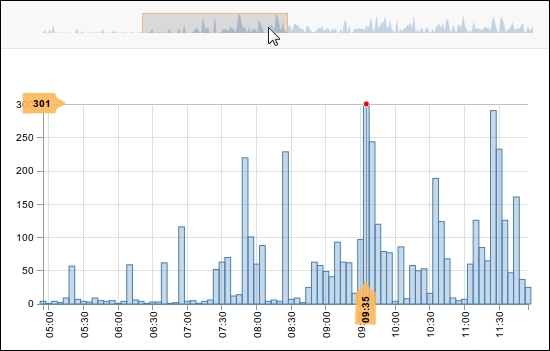
Filtering time scale axis with a brush
This brush looks really cool as a filter; we also want to implement such a brush for the start and end date filter of the application. The goal is to build a very simple area chart in the navigation bar that shows the data of the first chart. This chart should serve as a graphical date filter, where we...