Book Image

Hands-on Full-Stack Web Development with GraphQL and React

By : Sebastian Grebe
Book Image

Hands-on Full-Stack Web Development with GraphQL and React

By: Sebastian Grebe

Overview of this book

React, one of the most widely used JavaScript frameworks, allows developers to build fast and scalable front end applications for any use case. GraphQL is the modern way of querying an API. It represents an alternative to REST and is the next evolution in web development. Combining these two revolutionary technologies will give you a future-proof and scalable stack you can start building your business around. This book will guide you in implementing applications by using React, Apollo, Node.js and SQL. We'll focus on solving complex problems with GraphQL, such as abstracting multi-table database architectures and handling image uploads. Our client, and server will be powered by Apollo. Finally we will go ahead and build a complete Graphbook. While building the app, we'll cover the tricky parts of connecting React to the back end, and maintaining and synchronizing state. We'll learn all about querying data and authenticating users. We'll write test cases to verify the front end and back end functionality for our application and cover deployment. By the end of the book, you will be proficient in using GraphQL and React for your full-stack development requirements.
Table of Contents (15 chapters)

Useful development tools

When working with React, you will want to know why your application rendered in the way that it did. You need to know which properties your components received and how their current state looks. Since this is not displayed in the DOM or anywhere else in Chrome DevTools, you need a separate plugin.

Facebook has got you covered. Visit https://chrome.google.com/webstore/detail/react-developer-tools/fmkadmapgofadopljbjfkapdkoienihi and install React Developer Tools. This plugin allows the inspection of React applications and components. When opening Chrome DevTools again, you will see that there is a new tab at the end of the row.

If you are unable to see this tab, you may need to restart Chrome completely. You can also find React Developer Tools for Firefox.

This plugin allows you to view, search, and edit all of the components of your ReactDOM.

The left-hand panel looks much like the regular DOM tree (Elements) in Chrome DevTools, but instead of showing HTML markup, you see all of the components you used inside a tree. ReactDOM rendered this tree into real HTML, as follows:

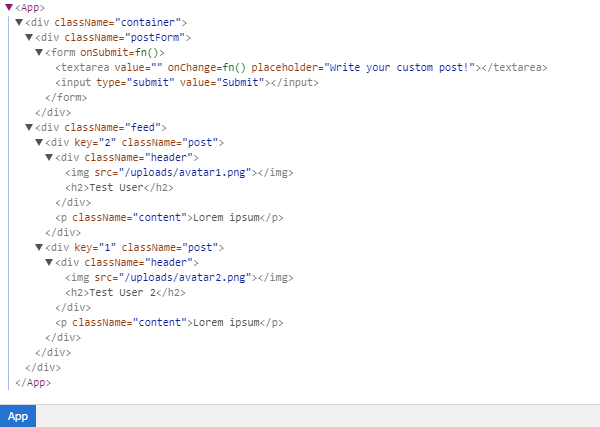
The first component in the current version of Graphbook should be <App />.

By clicking a component, your right-hand panel will show its properties, state, and context. You can try this with the App component, which is the only real React component:

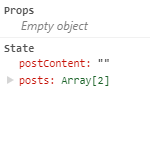
The App class is the first component of our application. This is the reason why it received no props. Children can receive properties from their parents; with no parent, there are no props.

Now test the App class and play around with the state. You will see that changing it rerenders your ReactDOM and updates the HTML. You can edit the postContent variable, which inserts the new text inside the textarea. As you can see, all events are thrown, and your handler runs. Updating the state always triggers a rerender, so try to update the state as little as possible.

Analyzing bundle size

People that are trying to use as little bandwidth as possible will want to keep their bundle size low. I recommend that you always keep an eye on this, especially when requiring more modules via npm. In this case, you can quickly end up with a huge bundle size, since npm packages tend to require other npm packages themselves.

To protect us against this, we need a method to analyze the bundle size. Only the production build is worth checking. As previously mentioned, the development build includes React in a development release with source maps and so on.

Thanks to webpack, there is a simple solution for analyzing our bundle. This solution is called webpack-bundle-analyzer, and it does exactly what it sounds like.

Install this with the following:

npm install --save-dev webpack-bundle-analyzer

You then need to add two commands to the scripts object in the package.json:

  • "stats": "webpack --profile --json --config webpack.client.build.config.js > stats.json"
  • "analyze": "webpack-bundle-analyzer stats.json"

The first command creates a production build as well as a stats.json file in the root folder. This file holds the information we need.

The analyze command spins up the webpack-bundle-analyzer, showing us how our bundle is built together and how big each package that we use is.

Do this as follows:

npm run stats
npm run analyze

You can visually see our bundle and package sizes. Remove unnecessary packages in your projects and see how your bundle is reorganized. You can take an example from the following screenshot:

This diagram looks a lot like WinDirStat which is a software to display the disk usage of your computer. We can identify the packages that make up the majority of our bundle.