Book Image

Web Development with Blazor

By : Jimmy Engström
Book Image

Web Development with Blazor

By: Jimmy Engström

Overview of this book

Blazor is an essential tool if you want to build interactive web apps without JS, but it comes with its own learning curve. Web Development with Blazor will help you overcome most common challenges developers face when getting started with Blazor and teach you the best coding practices. You’ll start by learning how to leverage the power of Blazor and explore the full capabilities of both Blazor Server and Blazor WebAssembly. Then you’ll move on to the practical part, which is centred around a sample project – a blog engine. This is where you’ll apply all your newfound knowledge about creating Blazor Server and Blazor WebAssembly projects, the inner working of Razor syntax, and validating forms, as well as creating your own components. You’ll learn all the key concepts involved in web development with Blazor, which you’ll also be able to put into practice straight away. By showing you how all the components work together practically, this book will help you avoid some of the common roadblocks that novice Blazor developers face and inspire you to start experimenting with Blazor on your other projects. When you reach the end of this Blazor book, you'll have gained the confidence you need to create and deploy production-ready Blazor applications.
Table of Contents (20 chapters)
1
Section 1:The Basics
4
Section 2:Building an Application with Blazor
14
Section 3:Debug, Test, and Deploy

Debugging Blazor WebAssembly in the web browser

The first debugging experience for Blazor WebAssembly was the ability to debug right in the web browser:

  1. In Visual Studio, start the project by pressing Ctrl + F5 (run without debugging).
  2. In the web browser, press Shift + Alt + D.

    We will get an error message with instructions on how to start the web browser in debug mode.

    I am running Edge, so the way to start Edge would be something like this:

    msedge --remote-debugging-port=9222 --user-data-dir="C:\Users\Jimmy\AppData\Local\Temp\blazor-edge-debug" --no-first-run https://localhost:5001/

    Copy the command.

  3. Press Win + R and paste the command.
  4. A new instance of Chrome or Edge will open. In this new instance, press Shift + Alt + D.
  5. We should now see a source tab containing C# code from our project. From here, we can put breakpoints that will be hit, and we can hover over variables.

The debug UI can be seen in Figure 12.4:
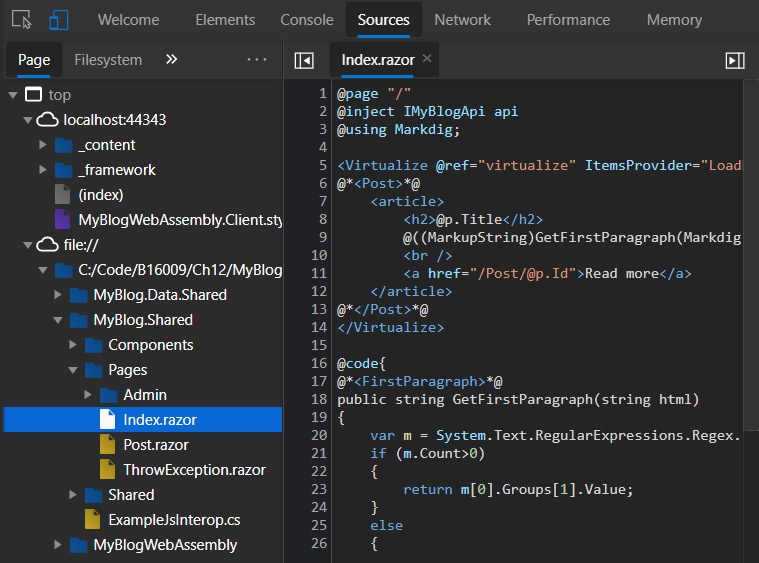
Figure 12.4 – Screenshot of the in-browser debug

Figure...