Book Image

Learn D3.js

By : Helder da Rocha
2 (1)
Book Image

Learn D3.js

2 (1)
By: Helder da Rocha

Overview of this book

This book is a practical hands-on introduction to D3 (Data-driven Documents): the most popular open-source JavaScript library for creating interactive web-based data visualizations. Based entirely on open web standards, D3 provides an integrated collection of tools for efficiently binding data to graphical elements. If you have basic knowledge of HTML, CSS and JavaScript you can use D3.js to create beautiful interactive web-based data visualizations. D3 is not a charting library. It doesn’t contain any pre-defined chart types, but can be used to create whatever visual representations of data you can imagine. The goal of this book is to introduce D3 and provide a learning path so that you obtain a solid understanding of its fundamental concepts, learn to use most of its modules and functions, and gain enough experience to create your own D3 visualizations. You will learn how to create bar, line, pie and scatter charts, trees, dendograms, treemaps, circle packs, chord/ribbon diagrams, sankey diagrams, animated network diagrams, and maps using different geographical projections. Fundamental concepts are explained in each chapter and then applied to a larger example in step-by-step tutorials, complete with full code, from hundreds of examples you can download and run. This book covers D3 version 5 and is based on ES2015 JavaScript.
Table of Contents (13 chapters)

Arc diagrams

Arc diagrams are linear layouts that place nodes along a horizontal axis connected by arcs. They are good for networks that don't have many nodes or connections, or sequential topologies with few orthogonal links (e.g. train networks). They are also better than chord layouts to represent directional flows, since links in opposite directions span arcs on different sides of the axis.

The following example is another version of Minard's Russian Campaign chart. Each node is a location and the arcs are troops. The width of each line is the number of troops marching between each location. The ochre-colored arcs above the axis are advances, and the gray arcs below the axis are retreats.

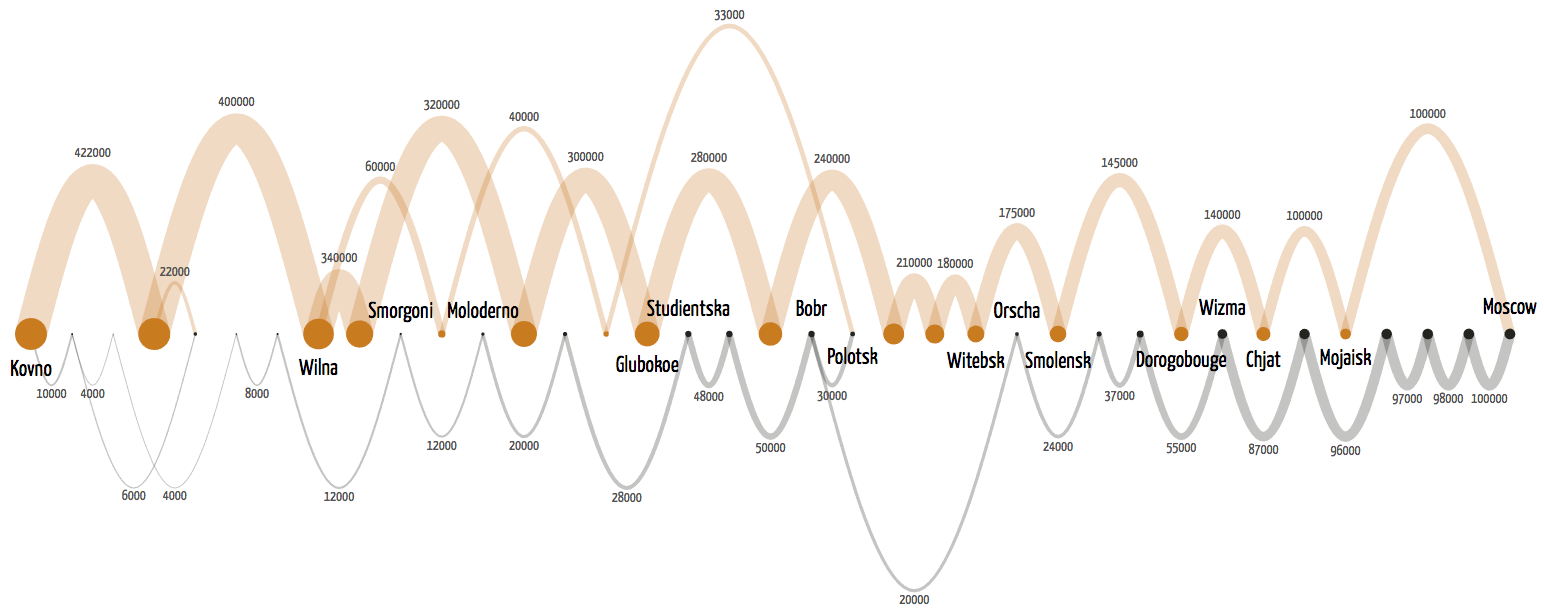
An arc diagram created from the same data as Charles Minard's famous Russian Campaign chart. Code: Examples/arc-8-minard.html.

D3 doesn't provide any generator function...