Book Image

Learn D3.js

By : Helder da Rocha
2 (1)
Book Image

Learn D3.js

2 (1)
By: Helder da Rocha

Overview of this book

This book is a practical hands-on introduction to D3 (Data-driven Documents): the most popular open-source JavaScript library for creating interactive web-based data visualizations. Based entirely on open web standards, D3 provides an integrated collection of tools for efficiently binding data to graphical elements. If you have basic knowledge of HTML, CSS and JavaScript you can use D3.js to create beautiful interactive web-based data visualizations. D3 is not a charting library. It doesn’t contain any pre-defined chart types, but can be used to create whatever visual representations of data you can imagine. The goal of this book is to introduce D3 and provide a learning path so that you obtain a solid understanding of its fundamental concepts, learn to use most of its modules and functions, and gain enough experience to create your own D3 visualizations. You will learn how to create bar, line, pie and scatter charts, trees, dendograms, treemaps, circle packs, chord/ribbon diagrams, sankey diagrams, animated network diagrams, and maps using different geographical projections. Fundamental concepts are explained in each chapter and then applied to a larger example in step-by-step tutorials, complete with full code, from hundreds of examples you can download and run. This book covers D3 version 5 and is based on ES2015 JavaScript.
Table of Contents (13 chapters)

A complete step-by-step example

This section will lead you through a complete SVG data-visualization application with D3. It's a larger example and more complex, but the concepts are the same, and most of the methods used were covered in this chapter. Each step is described briefly with some code examples, but you should download and try running the full listings available in the StepByStep/ folder from the GitHub repository for this chapter.

What are we going to create?

The following diagram is a sketch of the visualization we plan to create, showing the coordinates, spacing, and margins we will have to consider when drawing the shapes:

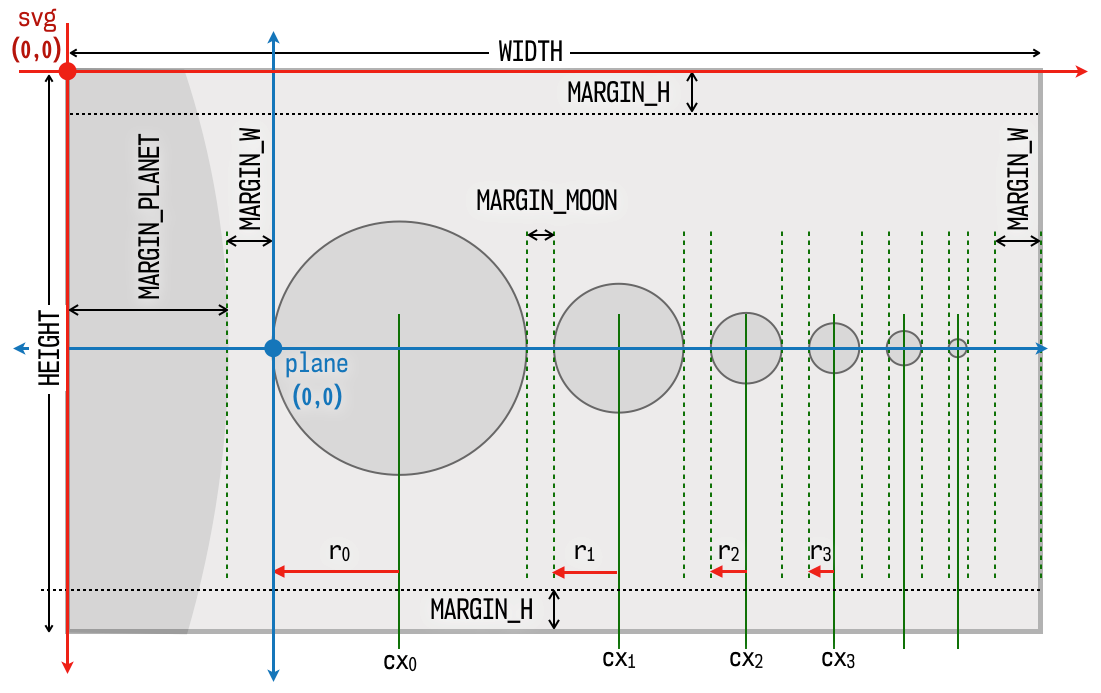
Sketch of the visualization that will be created

The page consists of six views...