

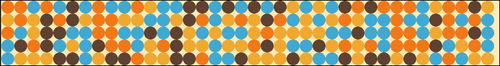
Canvas is the primary and most thrilling addition to HTML. It's the buzz of the industry, so let's start there. We will revisit canvas again in the later chapters. In this recipe, we will learn how to draw dynamically using canvas, and create an array of colorful circles that will update once every second.
We will be creating two files (an HTML5 file and a JS file). Let's start by creating a new HTML5 document:
The first step is to create an empty HTML5 document:
<!DOCTYPE html>
<html>
  <head>
    <meta charset="utf-8" />
    <title>Canvas Example</title>
  </head>
  <body>
  </body>
</html>
Tip
Downloading the example code
You can download the example code files for all Packt books you have purchased from your account at http://www.PacktPub.com. If you purchased this book elsewhere, you can visit http://www.PacktPub.com/support and register to have the files e-mailed directly to you.
The code files are also available at http://02geek.com/books/html5-graphics-and-data-visualization-cookbook.html.
Create a new canvas element. We give our canvas element an ID of
myCanvas:<body> <canvas id="myCanvas"> </canvas> </body>Import the JavaScript file
01.01.canvas.jsinto the HTML document (we will create this file in step 5):<!DOCTYPE html> <html> <head> <meta charset="utf-8" /> <script src="01.01.canvas.js"></script> <title>Canvas Example</title> </head>Add an
onLoadlistener and trigger the functioninitwhen the document loads:<!DOCTYPE html> <html> <head> <meta charset="utf-8" /> <script src="01.01.canvas.js"></script> <title>Canvas Example</title> </head> <body onLoad="init();" style="margin:0px"> <canvas id="myCanvas" /> </body> </html>Create the
01.01.canvas.jsfile.In the JavaScript file, create the function
initand call the functionupdateCanvaswithin it:function init(){ updateCanvas(); }Create the function
updateCanvas:function updateCanvas(){ //rest of the code in the next steps will go in here }In the
updateCanvasfunction (for the rest of the steps all the code will be added in this function) create two variables that will store your desired width and height. In our case we will grab the width of our window:function updateCanvas(){ var width = window.innerWidth; var height = 100; ...Access the canvas layer in the HTML document and change its width and height:
var myCanvas = document.getElementById("myCanvas"); myCanvas.width = width; myCanvas.height = height;Get the 2D context of the canvas:
var context = myCanvas.getContext("2d");Create a rectangle to fill the full visible area of the canvas:
context.fillStyle = "#FCEAB8"; context.fillRect(0,0,width,height);
Let's create a few helper variables to help us establish the color, size, and count of elements to be drawn:
var circleSize=10; var gaps= circleSize+10; var widthCount = parseInt(width/gaps); var heightCount = parseInt(height/gaps); var aColors=["#43A9D1","#EFA63B","#EF7625","#5E4130"]; var aColorsLength = aColors.length;
Create a nested loop and create a grid of circles in random colors:
for(var x=0; x<widthCount;x++){ for(var y=0; y<heightCount;y++){ context.fillStyle = aColors[parseInt(Math.random()*aColorsLength)]; context.beginPath(); context.arc(circleSize+gaps*x,circleSize+ gaps*y, circleSize, 0, Math.PI*2, true); context.closePath(); context.fill(); } } }
Woah! That was a lot of steps! If you followed all the steps, you will find a lot of circles in your browser when you run the application.
Before we jump right into the JavaScript portion of this application, we need to trigger the onLoad event to call our init function. We do that by adding the onLoad property into our HTML body tag:
<body onLoad="init();">
Let's break down the JavaScript portion and understand the reason behind doing this. The first step is to create the init function:
function init(){
  updateCanvas();
}Our init function immediately calls the updateCanvas function. This is done so that later we can refresh and call updateCanvas again.
In the updateCanvas function, we start by getting the current width of the browser and set a hardcoded value for the height of our drawing area:
var width = window.innerWidth; var height = 100;
Our next step is to get our canvas using its ID, and then set its new width and height based on the previous variables:
var myCanvas = document.getElementById("myCanvas");
    myCanvas.width = width;
myCanvas.height = height;It's time for us to start drawing. To do that, we need to ask our canvas to return its context. There are a few types of contexts such as 2D and 3D. In our case we will focus on the 2D context as follows:
var context = myCanvas.getContext("2d");Now that we have the context, we have all that we need to start exploring and manipulating our canvas. In the next few steps, we define the canvas background color by setting the fillStyle color using a hex value and by drawing a rectangle that would fit within the entire area of our canvas:
var context = myCanvas.getContext("2d");
context.fillStyle = "#FCEAB8";
context.fillRect(0,0,width,height);
The fillRect method takes four parameters. The first two are the (x,y) locations of the rectangle, in our case we wanted to start from (0,0), and the following parameters are the width and height of our new rectangle.
Let's draw our circles. To do so we will need to define the radius of our circle and the space between circles. Let's not space out the circles at all, and create circles with a radius of 10 px.
var rad=10;
var gaps= rad*2;
The first line assigns the radius for our circles, while the second line captures the gap between the centres of each circle we create, or in our case the diameter of our circle. By setting it up as two times the radius we space out our circles exactly one after the other.
var widthCount = parseInt(width/gaps);
var heightCount = parseInt(height/gaps);
var aColors=["#43A9D1","#EFA63B","#EF7625","#5E4130"];
var aColorsLength = aColors.length;
Using our new gaps variable, we discover how many circles we can create in the width and height of our canvas component. We create an array that stores a few color options for our circles and set a variable aColorsLength
as the length of aColors. We do this to cut down the processing time, as variables are easier to fetch than properties as we are about to call this element many times in our for loop:
for(var x=0; x<widthCount;x++){
  for(var y=0; y<heightCount;y++){
    context.fillStyle = aColors[parseInt(Math.random()*aColorsLength)];
    context.beginPath();
    context.arc(rad+gaps*x,rad+ gaps*y, rad, 0, Math.PI*2, true);
    context.closePath();
    context.fill();
  }
}
Our nested for loops enable us to create our circles to the width and height of our canvas. The first for loop focuses on upgrading the width value while the second for loop is in charge of running through every column.
context.fillStyle = aColors[parseInt(Math.random()*aColorsLength)];
Using Math.random, we randomly select a color from aColors to be used as the color of our new circle.
context.beginPath();
context.arc(rad+gaps*x,rad+ gaps*y, rad, 0, Math.PI*2, true);
context.closePath();
The first and last lines in the previous block of code declare the creation of a new shape. The beginPath method defines the start of the shape and the closePath method defines the end of it, while context.arc creates the actual circle. The arc property takes the following format of values:
context.arc(x,y,radius,startPoint,endPoint, isCounterClock);
The x and y properties define the center point of the arc (in our case a full circle). In our for loops we need to add a buffer of an extra radius to push our content into the screen. We need to do this as only one fourth of our first circle would be visible if we didn't push it to the left and to the bottom by an extra radius.
context.fill();
Last but not least, we need to call the fill() method to fill our newly-created shape with its color.
Let's make our element refresh once a second; to do that all we need to do is add two more lines. The first one will trigger a new call to the updateCanvas function once every second using
setInterval.
function init(){
  setInterval(updateCanvas,1000);
  updateCanvas();
}
If you refresh your browser you will find that our sample is working. If you try really hard to find issues with it you will not, but we have a problem with it. It's not a major problem but a great opportunity for us to learn about another useful functionality of the canvas. At any stage we can clear the canvas or parts of it. Instead of drawing on top of the current canvas, let's clear it before we redraw. In the updateCanvas function, we will add the following highlighted code:
var context = myCanvas.getContext("2d");
context.clearRect(0,0,width,height);
As soon as we get the context we can clear the data that was already present by using the clearRect method.