

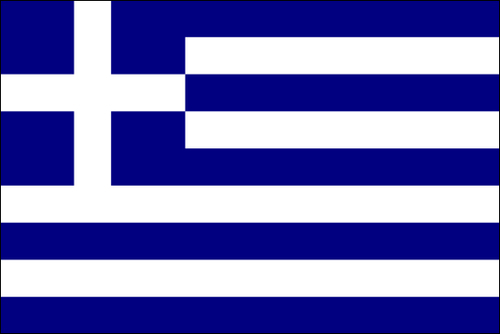
We learned as we created the flag for Palau that when we create a circle using the arc method, we have to trigger a request separately to fill the shape. This is true for all shapes that we create from scratch, and it is true for creating lines as well. Let's move to a slightly more complex flag: the flag of Greece.
As in the previous recipe, we will be skipping the HTML part and will jump right into the JavaScript portion of drawing in the canvas. For a detailed explanation of the steps involved in the creation of the canvas element, please refer to the first recipe of this chapter.
Before you start coding, look at the flag closely and try to come up with an attack plan on the steps you would need to perform to create this flag.
If we look at the flag, it's easy to figure out how to plan this out. There are many ways to do this but the following is our attempt:
We will first start our app and create a blank blue canvas:
  var canvas = document.getElementById("greece");
  var wid = canvas.width;
  var hei = canvas.height;


  var context = canvas.getContext("2d");
      context.fillStyle = "#000080";
      context.fillRect(0,0,wid,hei);
If you take a look at the previous figure, there are four white strips and five blue strips that will be part of the background. Let's divide the total height of our canvas by
9, so we can find out the right size for our lines:var lineHeight = hei/9;
So far we created shapes using built-in tools, such as
arcandfillRect. Now we are going to draw our lines manually, and to do so we will set thelineWidthandstrokeStylevalues, so we can draw lines on the canvas:context.lineWidth = lineHeight; context.strokeStyle = "#ffffff";
Now, let's loop through and create four times a line that goes from the right-hand side to the left-hand side, as follows:
  var offset = lineHeight/2;
  for(var i=1; i<8; i+=2){
    context.moveTo(0,i*lineHeight + offset);
    context.lineTo(wid,i*lineHeight+offset);

  }
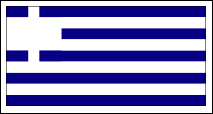
That's it, we got it. Reload your HTML page and you will find the flag of Greece in all its glory. Well not in all its glory yet, but just about enough to guess it's the flag of Greece. Before we move on let's look deeper into how this works.
Notice the addition of an offset. This is done because lineWidth grows in both directions from the actual point in the center of the line. In other words, a line with the width of 20 pixels that is drawn from (0, 0) to (0, height) would only have 10 pixels visible as the range of the thickness of the line would be between (-10 to 10). As such, we need to take into account that our first line needs to be pushed down by half its width so that it's in the right location.
The moveTo function takes in two parameters moveTo(x,y). The lineTo function also takes two parameters. I believe you must have guessed the difference between them. One will shift the virtual point without drawing anything while the other will create a line between the points.
If you run your HTML file, you will find that our lines were not revealed. Don't worry, you didn't make any mistake (At least, that's what I think ;)). For the lines to become visible, we need to tell the browser that we are ready, just like we called the fill() method when we used arc. In this case, as we are creating lines we will call the stroke() method right after we are done defining our lines, as follows:
var offset = lineHeight/2;
  for(var i=1; i<8; i+=2){
    context.moveTo(0,i*lineHeight + offset);
    context.lineTo(wid,i*lineHeight+offset);

  }
  context.stroke();
If you refresh the screen now you will see we are getting much closer. It's time for us to add that rectangle on the top-left area of the screen. To do that, we will reuse our lineHeight variable. The size of our rectangle is five times the length of lineHeight:
context.fillRect(0,0,lineHeight*5,lineHeight*5);
It is now time to create the cross in the flag:
  context.moveTo(0, lineHeight*2.5);
  context.lineTo(lineHeight*5,lineHeight*2.5);
  context.moveTo(lineHeight*2.5,0);
  context.lineTo(lineHeight*2.5,lineHeight*5+1);
  context.stroke();
If you run the application now you will be really disappointed. We did exactly what we learned previously but it's not working as expected.
The lines are all mixed up! OK fear not, it means it's time for us to learn something new.
Our flag didn't pan out that well because it got confused by all the lines we created earlier. To avoid this, we should tell the canvas when we are starting a new drawing and when we are ending it. To do so we can call the beginPath and closePath methods to let the canvas know that we are done with something or are starting with something new. In our case by adding the method beginPath we can fix our flag issue.
  context.fillRect(0,0,lineHeight*5,lineHeight*5);
  context.beginPath();
  context.moveTo(0, lineHeight*2.5);
  context.lineTo(lineHeight*5,lineHeight*2.5);
  context.moveTo(lineHeight*2.5,0);
  context.lineTo(lineHeight*2.5,lineHeight*5+1);
  context.stroke();
Congratulations! You just created your first two flags, and in the process learned a lot about how the canvas API works. This is enough to be able to create 53 country flags out of the 196 flags out there. That's a great start already; 25 percent of the world is in your hands.
The most complex flag you should be able to do right now is the flag of the United Kingdom. If you feel like exploring, give it a go. If you're really proud of it drop me a line at <[email protected]>, I would love to see it.