

Another alternative much discussed by the community of developers is transforming the table into a graphic when it is being displayed on small screen devices. This is not an easy task taking into account the size and amount of data that a table can have.
Let's see an alternative solution combining the previous recipes with another plugin for rendering graphics. The main reason for this combination is we use only one plugin per page, thus optimizing our load.
We maintained the same structure for our table, however this time we do not use this example and load it via AJAX. So the markup looks as follows, code example, Chapter06_Codes_1:
<table id="dynamicTable" class="table">
    <thead>
        <tr>
          <th>Reviews</th>
          <th>Top</th>
          <th>Rolling Stones</th>
          <th>Rock Hard</th>
          <th>Kerrang</th>
        </tr>
      </thead>
      <tbody>
        <tr>
          <th>Ac/Dc</th>
          <td>10</td>
          <td>9</td>
          <td>8</td>
          <td>9</td>
        </tr>
        <tr>
          <th>Queen</th>
          <td>9</td>
          <td>6</td>
          <td>8</td>
          <td>5</td>
        </tr>
        <tr>
          <th>Whitesnake</th>
          <td>8</td>
          <td>9</td>
          <td>8</td>
          <td>6</td>
        </tr>
        <tr>
          <th>Deep Purple</th>
          <td>10</td>
          <td>6</td>
          <td>9</td>
          <td>8</td>
        </tr>
        <tr>
          <th>Black Sabbath</th>
          <td>10</td>
          <td>5</td>
          <td>7</td>
          <td>8</td>
        </tr>
      </tbody>
</table>Let's see what we need to do:
Add a div right on the top of our table with an ID called
graph:<div id="graph"></div>
We will use a jQuery Plugin called Highcharts, which can be downloaded for free from http://www.highcharts.com/products/highcharts.
Add the following script to the bottom of our document:
<script src="highcharts.js"></script>
Add a simple script to initialize the graph as follows:
      var chart;
      Highcharts.visualize = function(table, options) {
         // the data series
          options.series = [];
          var l= options.series.length;
          options.series[l] = {
            name: $('thead th:eq('+(l+1)+')', table).text(),
            data: []
          };
         $('tbody tr', table).each( function(i) {
            var tr = this;
            var th = $('th', tr).text();
            var td = parseFloat($('td', tr).text());
            options.series[0].data.push({name:th,y:td});
         });
         chart = new Highcharts.Chart(options);
      }
      // On document ready, call visualize on the datatable.
      $(document).ready(function() {

         var table = document.getElementById('dynamicTable'),
         options = {
               chart: {
                  renderTo: 'graph',
                  defaultSeriesType: 'pie'
               },
               title: {
                  text: 'Review Notes from Metal Mags'
               },
               plotOptions: {
                    pie: {
                        allowPointSelect: true,
                        cursor: 'pointer',
                        dataLabels: {
                            enabled: false
                        },
                        showInLegend: true
                    }
                 },
               tooltip: {
                    pointFormat: 'Total: <b>{point.percentage}%</b>',
                    percentageDecimals: 1
                  }
      };

   Highcharts.visualize(table, options);
});
Many people choose to hide the div with the table in smaller devices and show only the graph.
Once they've optimized our table and depending on the amount of data, there is no problem. It also shows that the choice is yours.
Now when we look at the browser, we can view both the table and the graph as shown in the following screenshot:

Browser screenshot at 320px.
Highcharts plugins have an excellent quality in all browsers and works with SVG, they are compatible with iPad, iPhone, and IE 6.
The plugin can generate the table using only a single data array, but by our intuition and step-by-step description of its uses, we have created the following code to generate the graph starting from a table previously created.
We create the graph using the id#= dynamicTable function, where we read its contents through the following function:
$('tbody tr', table).each( function(i) {
            var tr = this;
            var th = $('th', tr).text();
            var td = parseFloat($('td', tr).text());
            options.series[0].data.push({name:th,y:td});
         });
In the plugin settings, we set the div graph to receive the graph after it is rendered by the script. We also add a pie type and a title for our graph.
options = {
               chart: {
                  renderTo: 'graph',
                  defaultSeriesType: 'pie'
               },
               title: {
                  text: 'Review Notes from Metal Mags'
},We can hide the table using media query so that only the graph appears. Remember that it just hides the fact and does not prevent it from being loaded by the browser; however we still need it to build the graph.
For this, just apply display none to the table inside the breakpoint:
@media only screen and (max-width: 768px) {

    .table { display: none; }
}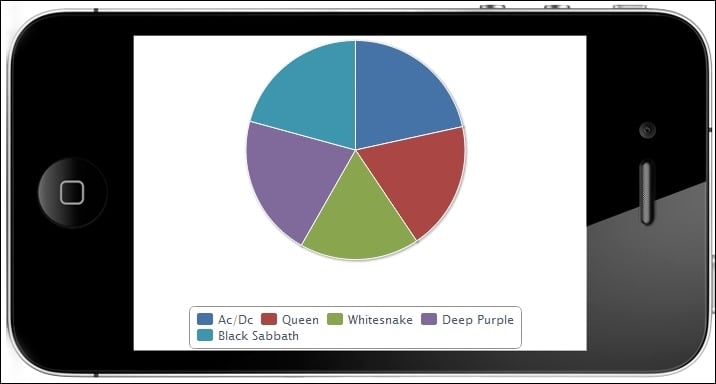
Browser screenshot at 320px, without the table