Download code from GitHub
Chapter 1: Data Management – Introduction and Concepts
A vast amount of data is being generated by people, organizations, devices, and software applications, and the volume of data being generated is growing rapidly. The numbers vary significantly, depending on the source, but it is estimated that approximately 60% to 80% of data gathered by organizations is dark data. Essentially, data is being collected, processed, and stored for a long time by organizations for compliance reasons, but the data is not used for any other purposes, such as analytics or direct monetization. In most cases, storing and securing this data can be more expensive than the value extracted.
In today’s digital economy, organizations are striving to be data-driven by basing their strategic business decisions on intelligence that’s been obtained from data gathered from various sources. Until recently, organizations thought of data purely in the context of transactions and locked it away in heavily siloed databases that were built for transaction processing; however, this was not suitable for open-ended analysis. All this changed with advancements in data processing techniques and drops in the costs involved in processing and analyzing data. Organizations are now adopting data-driven approaches for key business decisions.
In this chapter, we will cover the following topics:
- Types of data processing – OLTP and OLAP
- Data warehouses and data marts
- Data lakes
- Data lakehouse
- Data mesh
- Apache Spark on the AWS cloud
- AWS Glue
- Querying data using AWS
The topics in this chapter will introduce us to different data management techniques and different tools and services offered by the AWS cloud. These concepts will help you understand the different design approaches you can take to build effective data integration and management setups that are suitable to your use cases when using AWS Glue.
Types of data processing – OLTP and OLAP
Traditionally, data storage systems have been classified as Online Transaction Processing (OLTP) and Online Analytical Processing (OLAP). OLTP systems are responsible for day-to-day business executions. For instance, when you call your phone carrier’s customer service to add a new value pack to your phone plan, the customer service agent quickly pulls up the account information for your phone number and adds your desired value pack. The system that’s used by the customer service agent is designed to be fast so that the customer wait time can be minimized, which allows the customer service agent to be more efficient and serve customers faster. The system is also designed so that it updates the data quickly so that a large number of concurrent transactions can be processed. This allows the customer service agent to confirm that the value pack has been successfully applied to the account. Other examples include banking and shopping applications.
These faster updates are achieved by using a normalized data model. Normalization is the process of structuring the dataset as per a set of normal-forms to reduce redundancy and enhance data integrity. The normalized data model ensures that you don’t update multiple tables with the same information for a user operation. This is done by reducing the redundancy of the data in these systems. For example, if a customer updates their preferred_name, we can make this change in one table; the rest of the dependent tables will use customer_id to fetch updated information. So, a typical SQL query for the CRM application that’s used by the customer service agent contains the customer_id = 'xxxxxx' expression or data_plan_id = 'xxxxxx' in the WHERE clause.
These OLTP systems are not designed for obtaining or analyzing trends – for example, a query for gathering the mobile data usage (volume) of all customers over the last 2 years. Such queries involve joining a lot of tables on the OLTP side because of normalizations and usually results in poor performance as the amount of data scales up.
This problem can be solved by using OLAP systems. OLAP systems typically use the data warehouse of an organization, where they are utilized for executing complex queries over a large amount of data. They generally store historical datasets.
So, while both OLAP and OLTP have different ways of storing data and are designed for different use cases, the data on which they operate can be the same – the data is just modeled differently. Since both systems work on the same data, the data must be moved from one system to another. OLTP systems support live business transactions, so data generally originates there. This data is then brought into a data warehouse through an Extract, Transform, Load (ETL) or Extract, Load, Transform (ELT) tool so that it can then be consumed by OLAP systems. The following table explains the differences between OLTP and OLAP:
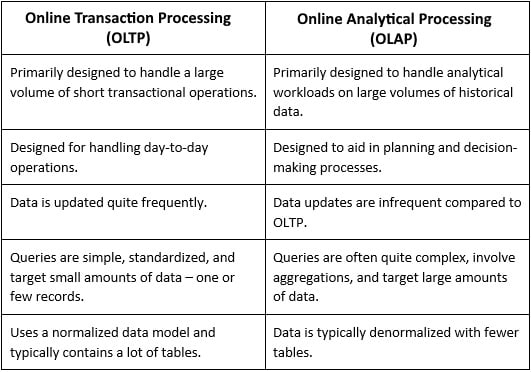
Table 1.1 – Differences between OLTP and OLAP
Now that we understand the fundamentals of the OLTP and OLAP models, let’s explore different data management systems, such as data warehouses, data marts, data lakes, data lakehouses, and data meshes.
Data warehouses and data marts
In an organization, it is not uncommon for day-to-day operations to be performed and stored in several transactional operating systems. However, when higher-level business decisions are to be made using data gathered from these systems, it would be easier to collate necessary information from these sources and build a centralized repository for datasets to gather actionable intelligence.
A data warehouse is a centralized repository of data that’s been gathered from various sources within an organization. The collated data within this repository is analyzed and can be used to make business decisions. A data mart, on the other hand, is a subset of a data warehouse aligned toward a specific business unit within an organization.
The concept of data warehouses was introduced in the late 1980s. Data warehouses are subject-oriented, integrated, time-variant, and non-volatile. This means that data warehouses are designed to be able to make sense of the data in a specific subject rather than ongoing operations, such as sales, marketing, and HR. Data warehouses are also designed to integrate data for several different source systems, such as Enterprise Resource Planning (ERP), Human Resource Management Systems (HRMSs), Customer Relationship Management (CRM), Financial Management Systems (FMSs), and any other operational systems within an organization. The data within a data warehouse is usually structured, but it can be unstructured as well. Data warehouses also allow users to analyze the data at different grains of time, such as year, month, and day. The data in data warehouses is non-volatile and maintains history. So, changes in the source systems result in newer entries in the data warehouses where the new state of the data is used while preserving the old state of the data.
In Inmon’s top-down data warehousing approach, data architects and modelers start by looking at the holistic data landscape of an organization and identifying the main subject areas and entities under it. Inmon’s data warehouse is normalized and avoids redundancy. This simplifies the data ingestion process but is not optimized for queries. Hence, data marts are built on top of data warehouses and users access these data marts for their queries.
While data marts can be based on a star or snowflake schema, the star schema is generally preferred because it results in faster queries due to fewer joins. In 1996, Ralph Kimball introduced the star schema methodology to the data management world. This follows the bottom-up approach and creates data marts based on the business requirements instead of starting with an enterprise data warehouse.
In a data mart, data is stored at multiple levels and the table at the correct level is picked for processing the data. The atomic level by which the facts may be defined is known as the grain or granularity of the table.
For example, let’s consider a retail sales dataset for a retail store chain operating in different countries. A customer could buy several products in a single sale and the same customer could buy higher quantities of the same product within the same sale. We can have a table that contains region information that can be linked to sales and product tables.
So, while selecting a grain, it is beneficial to have the fact table populated with the most atomic grain. This allows us to be as granular as we want with the information we query. If we define the grain at the sales transaction level, we can query individual sales transactions and get information such as the amount per sale, payment method, and so on. However, we won’t be able to get the product information in a particular sale. To mitigate this, let’s say we define the grain at the product in a sales transaction level. We can query product-related information along with sales information.
These different levels of pre-computation help us avoid heavy computations at query time. For example, if a user is querying for sales_amount at the region level, it might be far easier to select the data from the table that contains the sales_amount and region columns.
As we can see, data marts are helpful for working with datasets related to a specific context or a business line. However, a centralized data warehouse is beneficial when our analysis needs data to be aggregated from a variety of sources across the organization to extract actionable intelligence from the dataset.
A fresh approach to data warehousing came with the introduction of data vaults. This is a hybrid approach that incorporates the best-normalized model and a denormalized star schema. This approach to data modeling can be quite helpful when working with multi-source systems or data sources that have constantly changing relationships. This makes it easier to ingest data from multiple sources. Also, because of the way the data is modeled, data vaults make it easier to audit and track data.
Data transformation is a requirement for the data to be loaded into a data warehouse. This creates entry barriers and lags in delivering value to customers. Generally, organizations have multiple sources of data and they must be imported into a data warehouse to make business decisions or even to know if it adds value. Later, if the user discovers that combining the data from certain sources is not delivering the value that was initially expected, then this results in time and resources being wasted. Also, it is not always possible to forecast the analytical requirements in a world where businesses have to constantly evolve to stay relevant. What happens if a business user needs historical data that isn’t available in the data warehouse? Around 2015, data lakes were created to solve these problems.
Data lakes
A data lake can be defined as a centralized repository that allows you to store all structured and unstructured data at any scale. With today’s hyper scalers providing cheap and durable storage, it is now possible for organizations to store all of their data in the cloud without significant cost implications. Data lakes are broken down into layers or zones.
In the first layer of the data lake, data is generally stored as-is. This reduces the entry barrier and enables organizations to move all of their data to the “lake” without significantly increasing development or maintenance costs. Because the first layer of the data lake is an as-is copy of the data, organizations can use an automated configuration-based pipeline to create newer sources.
Organizations usually pick a replication tool such as AWS Data Migration Service (AWS DMS) to bring the data into the data lake. While AWS DMS involves taking care of the replication infrastructure, it is mostly a hands-off mechanism for hydrating the lake. Organizations may also use a push mechanism to FTP to transfer the files to an AWS Simple Storage Service (S3)-based data lake using AWS Transfer Family.
Data from the first layer is compressed and partitioned, and audited columns are added during data preparation so that they can be used by downstream systems more effectively. Having all the data in the data lake enables data analysts to do the initial discovery to find out the value of combining data from various sources. If the value is discovered, then necessary transformations are applied in an ETL pipeline so that the target is hydrated with newer data periodically or through a streaming arrangement. These automated transformations are then loaded into the final layer of a data lake and used for user consumption.
Data lakehouse
Challenged by the newer demands to derive value from the vast and ever-increasing unstructured data, it became important to come up with a new arrangement that does not try to force unstructured data into the strict models of a data warehouse. The data lakehouse blurs the lines between data lakes and data warehouses by enabling the atomicity, consistency, isolation, and durability (ACID) properties on the data in the data lake and enabling multiple processes to concurrently read and write data.
With this, transformed data in open formats such as Apache Parquet can be consumed for feature engineering and machine learning (ML) workloads and can also be used for analytics.
Data mesh
While cheap, durable storage helped in storing vast volumes of data, this data had to be secured properly. Since data from a vast variety of sources is stored in the lake, it becomes difficult to define the ownership and management of this data. This requirement resulted in a paradigm of serving data as a product and setting the ownership of the product. This thought process led to the creation of the data mesh.
Data meshes ensure that data lakes don’t become another monolith that the organization’s IT teams now have to manage. This decentralization leads to the democratization of data, which fuels innovation without hindering access to the data. Although data is decentralized and offered as a service, the permission model that’s applied to create a data lake ensures interoperability to reduce the barriers to accessing data products for users that have the right permissions.
Distributed computing for big data
Before the advent of big data, ELT and ETL tools usually had a server and an orchestrator that was responsible for reading the data from the OLTP systems and populating the data warehouse. Some of these tools used the compute of these intermediate servers, while others used the compute of the target to process the data. Traditionally, these ETL/ELT systems were used to pull data once a day and during off-business hours. This was done to reduce the impact of the data being pulled from the OLTP systems. When a system required higher data processing capabilities, organizations would scale up the ETL/ELT servers.
This arrangement worked fine for a few years but the volume of data kept increasing, and scaling the ETL/ELT systems became cost prohibitive. With the world increasingly becoming more data-centric, the amount of data produced continued to grow. It is estimated that 90% of the data today has been generated in the last 2 years.
Not only has the volume of data increased, but organizations also want to get the data faster for quicker decision-making.
In a connected world, the number of variables that impact a business decision has increased, so there is a need to get data from multiple different sources to make a decision. For example, for a retail company to find out the discount to be applied to a certain product, it can no longer just rely on the cost price of the product and the profit that it expects from the sale. It would be beneficial to know the cost of keeping the product on the shelf before it is sold, along with knowing the approximate time for which the product is expected to stay on the shelf. The retail company may also want to know the price of the same product on competitor websites, along with the price of similar products with better features.
Here, the cost price can be obtained from the company’s ERP data. The percentage of expected profit might be a business transformation logic that uses their “secret sauce.” The cost of keeping the product on the shelf will be based on the cumulative sum of all the costs of the store. The approximate duration for which the product will be on the shelf might come from an ML model. The price of the same product sold by the competitors can be scraped from their websites and the cost of similar products with better features can be obtained from third-party market research. So, modern decision-making involves making sense of data from a variety of sources.
Big data is a collection of data derived from various sources and is characterized by the volume, velocity, variety, veracity, and value of the data. These are known as the 5 V’s of big data. While we collect the data from a variety of sources at a certain velocity and volume like never before, we also want to make sure that the collected data is accurate and can be trusted. This can be achieved using a series of validation steps based on the data being collected. Finally, once we have the trusted data, we want to be able to derive value from it.
When importing the data into a data lake or a data warehouse, the old arrangements of scaling up do not work, so we must deal with the 5 V’s of big data. The solution to these challenges came in the form of distributed computing.
Distributed computing systems distribute the workload of any given query to multiple workers instead of a single worker. The workloads being distributed across multiple worker nodes meant that organizations could now add nodes to increase the computing power rather than vertically scaling the node. The advantage of this approach is that we can process data on multiple nodes in parallel. This allows us to keep up with the high velocity of incoming data where one single node may not be enough.
With the advent of distributed computing in big data processing and analytics, several engines and frameworks were developed to handle different aspects of data processing and analysis. One of the most popular processing and analytics engines is Apache Spark.
Apache Spark
Apache Spark is an open source unified analytics engine that was originally developed in 2009 at UC Berkeley. It became a top-level Apache project in February 2014. It has over 1.7K contributors and over 30K star gazers on GitHub. The following is a quote from the Spark documentation (https://spark.apache.org/docs/latest/index.html):
“Apache Spark is a unified analytics engine for large-scale data processing. It provides high-level APIs in Java, Scala, Python, and R, and an optimized engine that supports general execution graphs. It also supports a rich set of higher-level tools including Spark SQL for SQL and structured data processing, MLlib for machine learning, GraphX for graph processing, and Structured Streaming for incremental computation and stream processing.”
At a high level, a Spark cluster consists of a set of executors running a Java Virtual Machine (JVM). One of these executors runs the Driver program. This driver program is responsible for creating a SparkContext. A SparkContext is the entry point for Spark features. Spark applications are instances of this SparkContext, which connects to a Cluster Manager.
The following diagram shows the workflow that’s used by Apache Spark to execute the workload. Here, the user submits the workload using the spark-submit command; then the Spark driver coordinates with the Cluster Manager to execute the workload within the executors on the worker nodes:
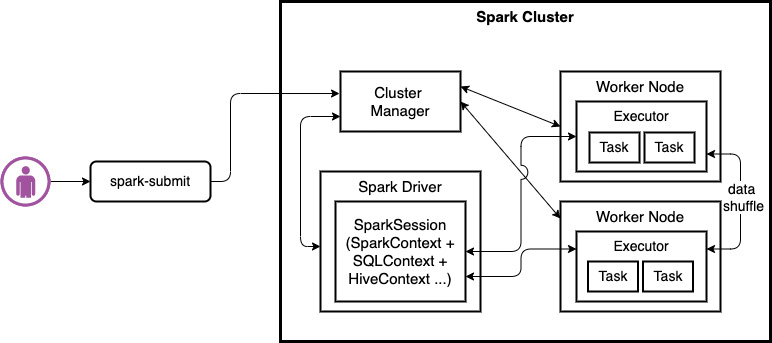
Figure 1.1 – Overview of Apache Spark’s workload execution
A Cluster Manager can be Spark’s standalone cluster manager, Mesos, Apache Hadoop Yet Another Resource Negotiator (YARN), or Kubernetes. Cluster Managers are responsible for allocating containers to various Spark applications running on the cluster. With YARN, Spark can run in either cluster mode or client mode.
In client mode, the driver program runs on the machine that submitted the Spark Job. In cluster mode, the driver program runs on one of the executors. Executors are responsible for executing the tasks that are sent through SparkContext and run in YARN’s JVMs containers. When we invoke an action in a Spark application, a Spark Job is created. A list of actions available in Spark can be found in the Apache Spark documentation (https://spark.apache.org/docs/latest/rdd-programming-guide.html#actions). To execute a Job, an execution plan must be created based on a Directed Acyclic Graph (DAG).
A DAG scheduler converts the logical execution plan into a physical execution plan. A DAG consists of stages. A Spark stage is a set of independent tasks all computing the same function that is needed as part of a Spark Job. Each stage is further divided into tasks. All of these tasks can be run in parallel on the CPU cores of the executors. Once Spark acquires the executors, SparkContext sends the tasks to the executors to perform.
Spark also has a component called SparkSQL which allows users to write SQL queries for data transformation. SparkSQL is enabled by the Catalyst and Tungsten engines.
Catalyst is responsible for creating a physical plan from a logical plan, while Tungsten is responsible for generating the byte code that will be executed on the cluster.
This new architecture of data processing came with challenges. Organizations now had to quickly develop a new skill set to manage clusters of nodes that were used for data processing. Also, what do you do with all these ETL compute nodes when they are not used for processing?
Apache Spark on the AWS cloud
The problem of unused compute resources was solved by the hyperscalers of the world. One of the leading hyperscalers is AWS. AWS has two offerings for managed Spark: Amazon EMR and AWS Glue. With Amazon EMR, customers get higher control of the underlying compute and can run Spark workloads on Amazon EC2 instances, on Amazon Elastic Kubernetes Service (EKS) clusters, or on-premises using EMR on AWS Outposts. Customers can also work with other open source tools such as Apache Spark, Apache Hive, Apache HBase, Apache Flink, Apache Hudi, and Presto on Amazon EMR.
AWS Glue
On August 14, 2017, AWS released a new service called AWS Glue. AWS Glue is a serverless data integration service. AWS Glue also provides some easy-to-use features that almost eliminate the administrative overhead of infrastructure management and simplify how common data integration tasks can be integrated.
Let’s look at some of the notable components of the AWS Glue feature set:
- AWS Glue DataBrew: Glue DataBrew is used for data cleansing and enrichment through another GUI. Creating AWS Glue DataBrew Jobs does not require the user to write any source code and the Jobs are created with the help of a GUI.
- AWS Glue Data Catalog: AWS Glue Data Catalog is a central catalog of metadata that can be used with other AWS services such as Amazon Athena, Amazon Redshift, and Amazon EMR.
- AWS Glue Connections: Glue Connections are catalog objects that help organize and store connection information to various data stores. AWS Glue Connections can also be created for Marketplace AWS Glue Connectors, which allows you to integrate with third-party data stores, such as Apache Hudi, Google Big Query, and Elastic Search.
- AWS Glue Crawlers: Crawlers can be used to crawl existing data and populate an AWS Glue Data Catalog with metadata.
- AWS Glue ETL Jobs: Glue ETL Jobs enables users to extract source data from various data stores, process it, and write output to a data target based on the logic defined in the ETL script. Users can take advantage of Apache Spark-based ETL Jobs to handle their workload in a distributed fashion. Glue also offers Python shell Jobs for ETL workloads; these don’t need distributed processing.
- AWS Glue Interactive Sessions: Interactive sessions are managed interactive environments that can be used to develop and test AWS Glue ETL scripts.
- AWS Glue Schema Registry: AWS Glue Schema Registry allows users to centrally control data stream schemas and has integrations with Apache Kafka, Amazon Kinesis, and AWS Lambda.
- AWS Glue Triggers: AWS Glue Triggers are data catalog objects that allow us to either manually or automatically start executing one or more AWS Glue Crawlers or AWS Glue ETL Jobs.
- AWS Glue Workflows: Glue Workflows can be used to orchestrate the execution of a set of AWS Glue Jobs and AWS Glue Crawlers using AWS Glue Triggers.
- AWS Glue Blueprints: Blueprints are useful for creating parameterized workflows that can be created and shared for similar use cases.
- AWS Glue Elastic Views: Glue Elastic Views helps users replicate the data from one store to another using familiar SQL syntax.
This book will focus on learning about AWS Glue, diving deep into the features listed here, and learning about how these features help solve the data problems of the modern world. We will also learn about the fundamental concepts of AWS LakeFormation, which are important for securely managing and administering the data assets of an organization.
Querying data using AWS
At the beginning of this chapter, we focused on various ways to collect and organize the data from various systems to enable various downstream workloads, such as feature engineering, data exploration, and analytics. While data lakes and data meshes have reduced the entry barrier to democratize data, you may still need to access data from various purpose-built stores.
Today’s applications are built around the microservice architecture, which allows teams to split vertically based on their functionality and scale independently. Organizations may have their two pizza teams working on different microservices. Each of these teams is independent and can pick its own purpose-built data stores to support its application.
In an ideal world, data from all of these purpose-built stores should flow into the data lake, but this might not always be the case. In a world where the speed of decision-making is paramount, data analysts may want to access the data and combine it even before the data starts hydrating the data lake.
This requirement led to the need for modern tools to support querying data across multiple different sources. In the AWS ecosystem, both Amazon Athena and Amazon Redshift allow you to query data across multiple data stores.
While using Amazon Athena to query S3 data cataloged in AWS Glue Catalog is quite common, Amazon Athena can also be used to query data from Amazon CloudWatch Logs, Amazon DynamoDB, Amazon DocumentDB, Amazon RDS, and JDBC-compliant relational data sources such MySQL and PostgreSQL under the Apache 2.0 license using AWS Lambda-based data source connectors. Athena Query Federation SDK can be used to write a customer connector too. These connectors return data in Apache Arrow format. Amazon Athena uses these connectors and manages parallelism, along with predicate pushdown.
Similarly, Amazon Redshift also supports querying Amazon S3 data through Amazon Redshift Spectrum. Redshift also supports querying data in Amazon RDS for PostgreSQL, Amazon Aurora PostgreSQL-Compatible Edition, Amazon RDS for MySQL, and Amazon Aurora MySQL-Compatible Edition through its Query Federation feature. Amazon Redshift offloads part of the computations to the target data stores and uses its parallel processing capabilities for the query’s operation.
To handle the undifferentiated heavy lifting, AWS Glue introduced a new feature called AWS Glue Elastic Views. It allows users to use familiar SQL. It combines and materializes the data from various sources into the target. Since AWS Glue Elastic Views is serverless, users do not have to worry about managing the underlying infrastructure or keeping the target hydrated.
Summary
In this chapter, we discussed data collection practices that are used by organizations and the issue of dark data. We also discussed different storage and processing techniques, such as OLTP and OLAP, and how organizations are using a combination of these two techniques to extract value from the data gathered. We briefly discussed the evolution of data management strategies such as data warehousing, data lakes, the data lakehouse, and data meshes and the role played by ETL and ELT processes in ingesting data into OLAP systems for analysis.
Then, we introduced the Apache Spark framework and talked about how Spark executes workloads by dividing them into different Spark Jobs, stages, and tasks. After this, we discussed different services in the AWS cloud that can be used to execute Spark workloads. We introduced AWS Glue and the different features available in Glue that make it a full-fledged data integration platform and not just a managed ETL service.
In the next chapter, we will discuss the different microservices that are available in AWS Glue and how they work. We will also focus on some Glue-specific features/enhancements that make AWS Glue an ideal service for your data integration workloads.