Book Image

Data Analysis with Python

By : David Taieb
Book Image

Data Analysis with Python

By: David Taieb

Overview of this book

Data Analysis with Python offers a modern approach to data analysis so that you can work with the latest and most powerful Python tools, AI techniques, and open source libraries. Industry expert David Taieb shows you how to bridge data science with the power of programming and algorithms in Python. You'll be working with complex algorithms, and cutting-edge AI in your data analysis. Learn how to analyze data with hands-on examples using Python-based tools and Jupyter Notebook. You'll find the right balance of theory and practice, with extensive code files that you can integrate right into your own data projects. Explore the power of this approach to data analysis by then working with it across key industry case studies. Four fascinating and full projects connect you to the most critical data analysis challenges you’re likely to meet in today. The first of these is an image recognition application with TensorFlow – embracing the importance today of AI in your data analysis. The second industry project analyses social media trends, exploring big data issues and AI approaches to natural language processing. The third case study is a financial portfolio analysis application that engages you with time series analysis - pivotal to many data science applications today. The fourth industry use case dives you into graph algorithms and the power of programming in modern data science. You'll wrap up with a thoughtful look at the future of data science and how it will harness the power of algorithms and artificial intelligence.
Table of Contents (16 chapters)
Data Analysis with Python
Contributors
Preface
Other Books You May Enjoy
3
Accelerate your Data Analysis with Python Libraries
Index

Filtering


To better explore data, PixieDust also provides a built-in, simple graphical interface that lets you quickly filter the data being visualized. You can quickly invoke the filter by clicking on the filter toggle button in the top-level menu. To keep things simple, the filter only supports building predicates based on one column only, which is sufficient in most cases to validate simple hypotheses (based on feedback, this feature may be enhanced in the future to support multiple predicates). The filter UI will automatically let you select the column to filter on and, based on its type, will show different options:

  • Numerical type: The user can select a mathematical comparator and enter a value for the operand. For convenience, the UI will also show statistical values related to the chosen column, which can be used when picking the operand value:

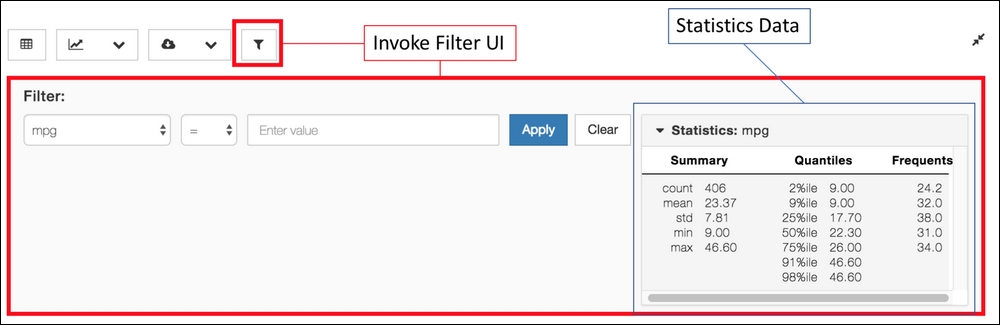
    Filter on the mpg numerical column of the cars data set

  • String type: The user can enter an expression to match the column value, which can...