Book Image

Python High Performance, Second Edition - Second Edition

By : Dr. Gabriele Lanaro
Book Image

Python High Performance, Second Edition - Second Edition

By: Dr. Gabriele Lanaro

Overview of this book

Python is a versatile language that has found applications in many industries. The clean syntax, rich standard library, and vast selection of third-party libraries make Python a wildly popular language. Python High Performance is a practical guide that shows how to leverage the power of both native and third-party Python libraries to build robust applications. The book explains how to use various profilers to find performance bottlenecks and apply the correct algorithm to fix them. The reader will learn how to effectively use NumPy and Cython to speed up numerical code. The book explains concepts of concurrent programming and how to implement robust and responsive applications using Reactive programming. Readers will learn how to write code for parallel architectures using Tensorflow and Theano, and use a cluster of computers for large-scale computations using technologies such as Dask and PySpark. By the end of the book, readers will have learned to achieve performance and scale from their Python applications.
Table of Contents (10 chapters)

Profiling memory usage with memory_profiler

In some cases, high memory usage constitutes an issue. For example, if we want to handle a huge number of particles, we will incur a memory overhead due to the creation of many Particle instances.

The memory_profiler module summarizes, in a way similar to line_profiler, the memory usage of the process.

The memory_profiler package is also available on the Python Package Index. You should also install the psutil module (https://github.com/giampaolo/psutil) as an optional dependency that will make memory_profiler considerably faster.

Just like line_profiler, memory_profiler also requires the instrumentation of the source code by placing a @profile decorator on the function we intend to monitor. In our case, we want to analyze the benchmark function.

We can slightly change benchmark to instantiate a considerable amount (100000) of Particle instances and decrease the simulation time:

    def benchmark_memory(): 
particles = [Particle(uniform(-1.0, 1.0),
uniform(-1.0, 1.0),
uniform(-1.0, 1.0))
for i in range(100000)]

simulator = ParticleSimulator(particles)
simulator.evolve(0.001)

We can use memory_profiler from an IPython shell through the %mprun magic command as shown in the following screenshot:

It is possible to run memory_profiler from the shell using the mprof run command after adding the @profile decorator.

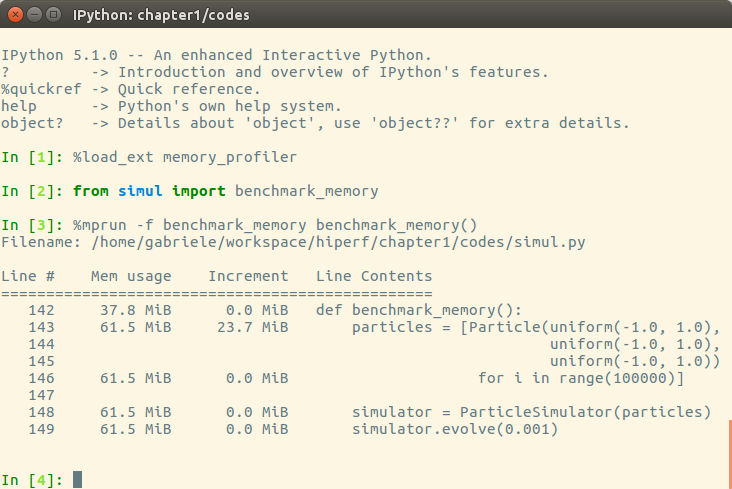
From the Increment column, we can see that 100,000 Particle objects take 23.7 MiB of memory.

1 MiB (mebibyte) is equivalent to 1,048,576 bytes. It is different from 1 MB (megabyte), which is equivalent to 1,000,000 bytes.

We can use __slots__ on the Particle class to reduce its memory footprint. This feature saves some memory by avoiding storing the variables of the instance in an internal dictionary. This strategy, however, has a drawback--it prevents the addition of attributes other than the ones specified in __slots__ :

    class Particle:
__slots__ = ('x', 'y', 'ang_vel')

def __init__(self, x, y, ang_vel):
self.x = x
self.y = y
self.ang_vel = ang_vel

We can now rerun our benchmark to assess the change in memory consumption, the result is displayed in the following screenshot:

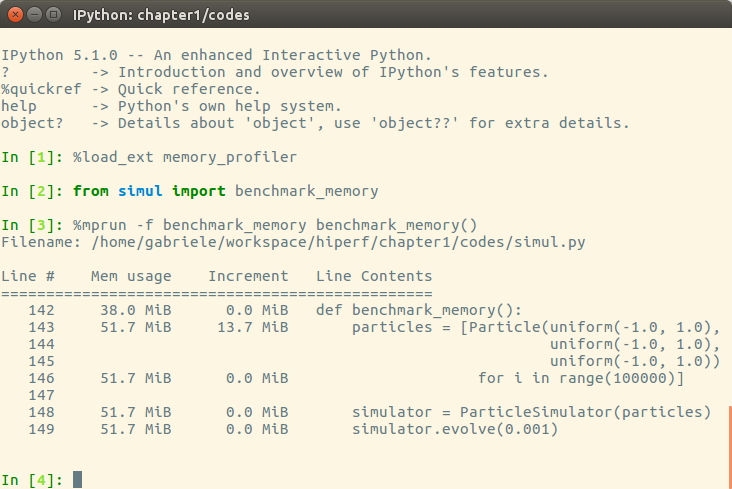
By rewriting the Particle class using __slots__, we can save about 10 MiB of memory.